Collaborative imaging


Collaborative imaging
Computed Tomography Clinical Applications
Computed Tomography Clinical Applications
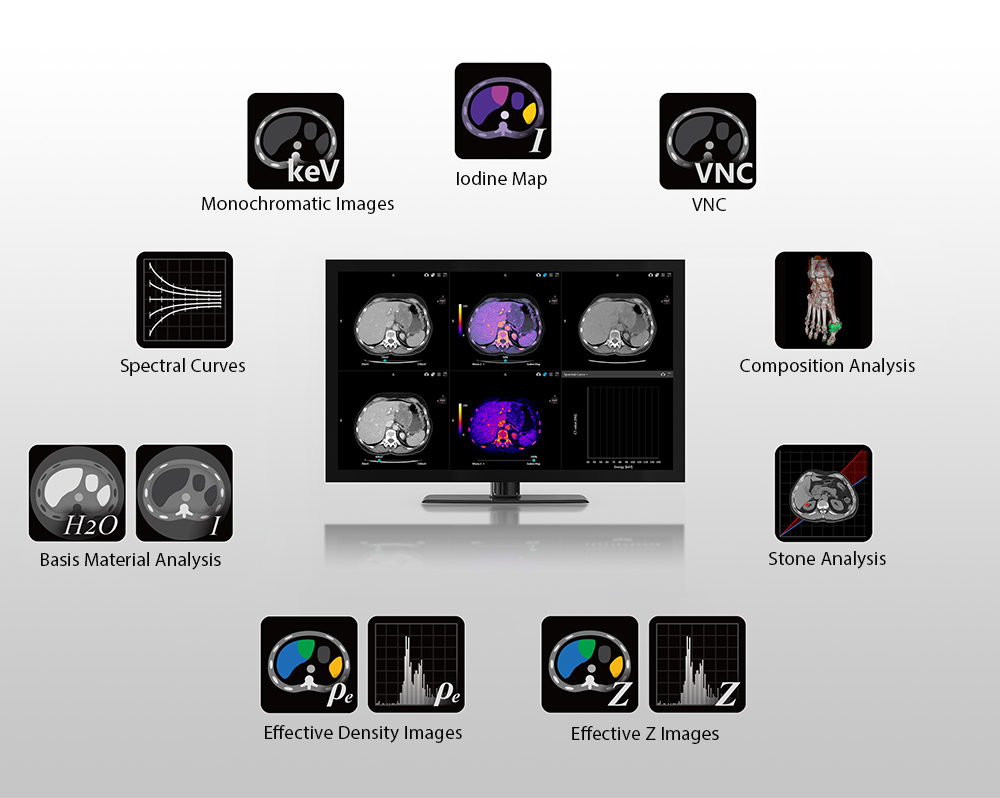
CT Deep Learning Spectral
A fully integrated end-to-end spectral workflow
The Aquilion ONE / PRISM Edition harnesses the temporal benefits of rapid kV switching with patient specific mA modulation and combines them with a Deep Learning reconstruction that delivers excellent energy separation and low-noise properties.
What’s more, its fully integrated end-to-end workflow is easy to use and can be conveniently incorporated into your routine protocols.
Computed Tomography Clinical Applications
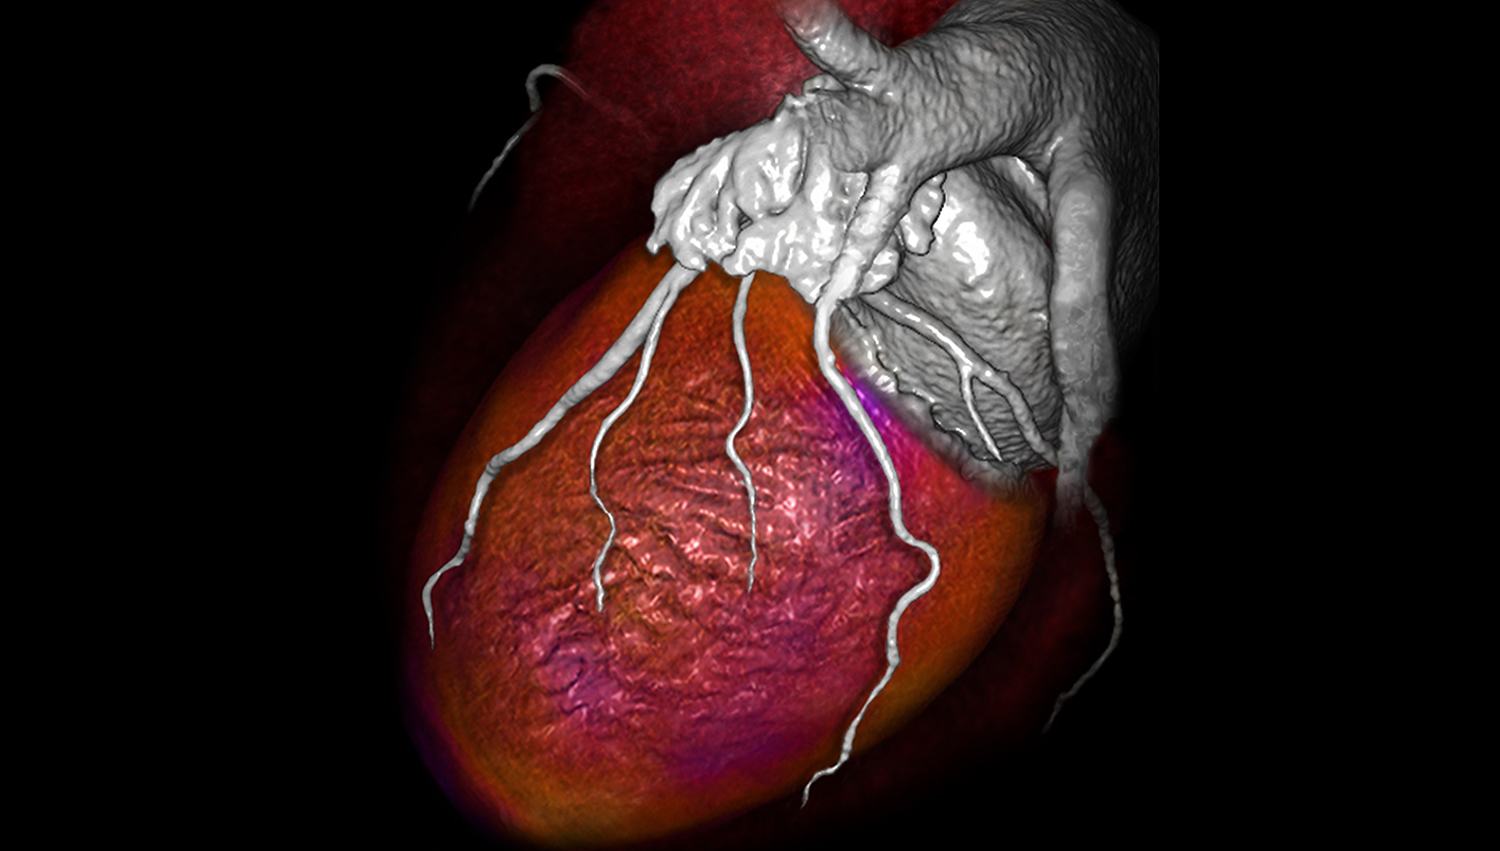
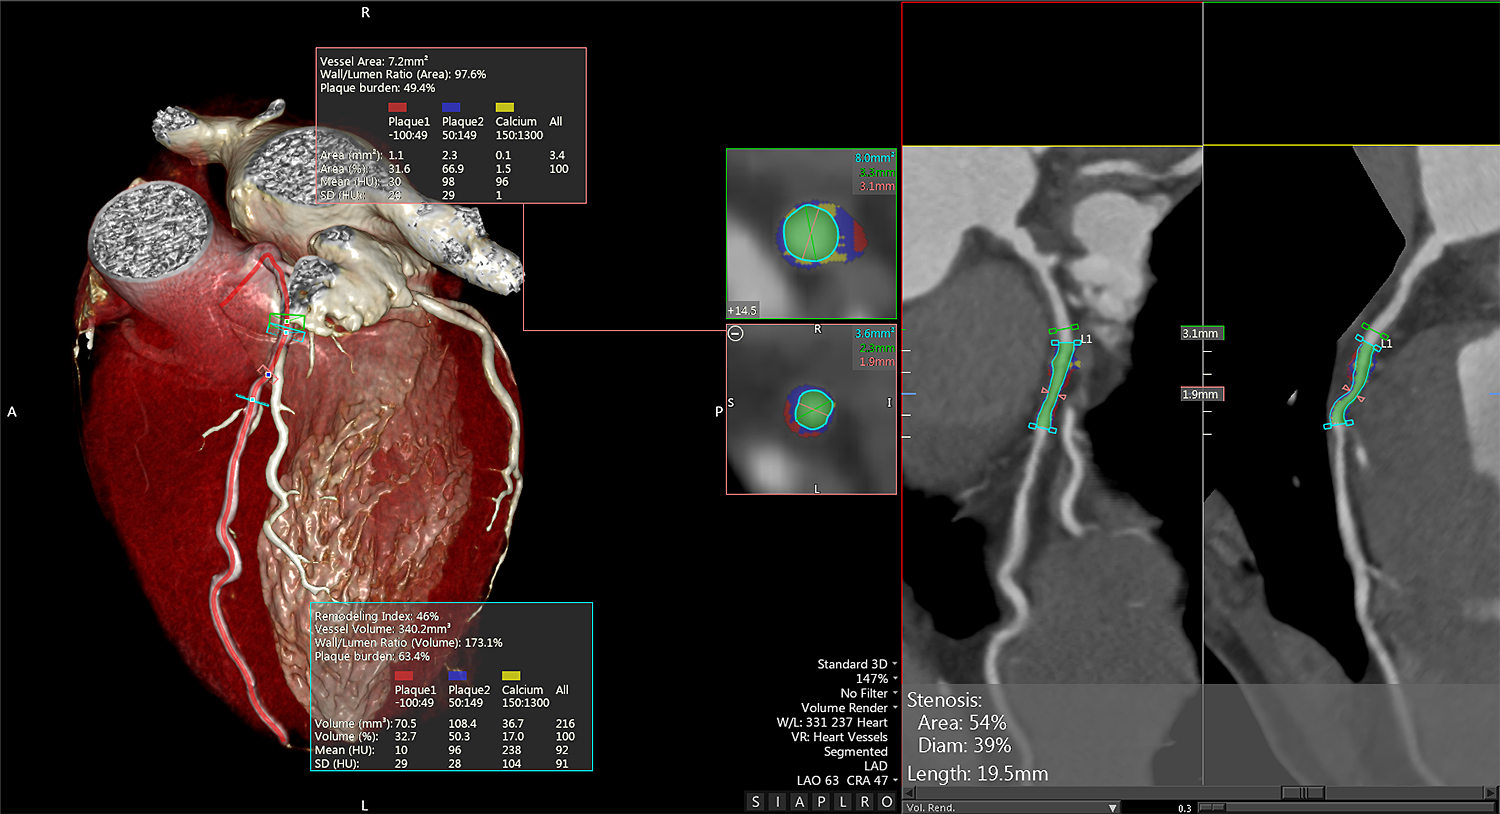
CT Cardiac Analysis
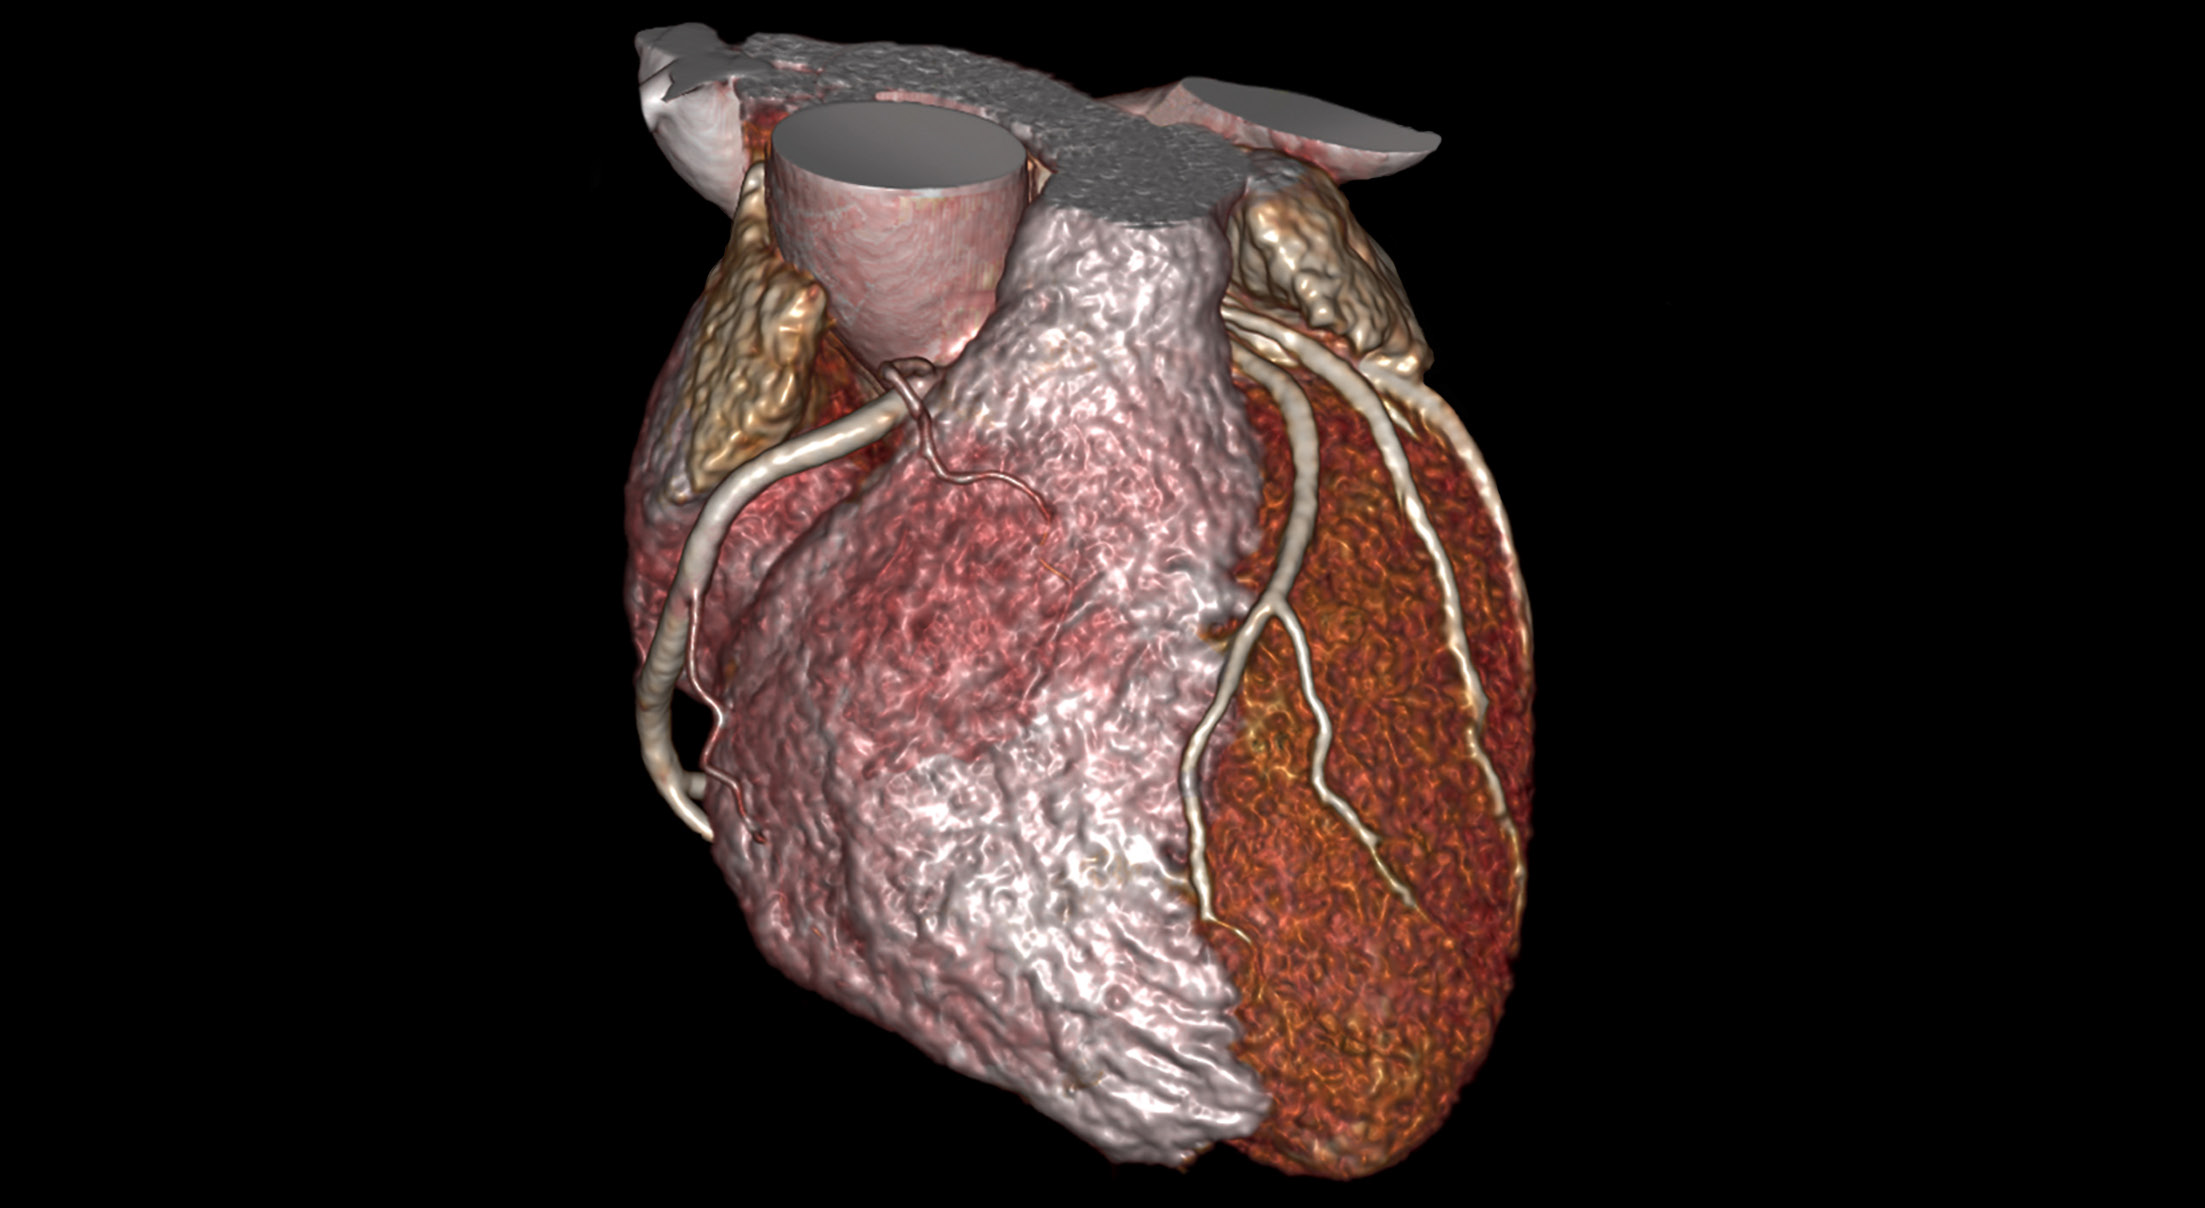
CT Cardiac Analysis* enables physicians to determine the presence and extent of coronary obstructive disease by displaying the extracted anatomy in a variety of views. The interface and automated tools help to efficiently analyze the coronary arteries.

Key Benefits
- Streamlined coronary workflow with automatic extraction of the coronary arteries and optimized viewports such as volume rendering, MIP, MPR, curved and straightened MPR views
- SUREPlaque™** tool assists clinicians in evaluating the characteristics inside blood vessels:
- Quantify plaque burden and coronary remodeling non-invasively
- Visualize coronary vessel anatomy and disease with ease using defined HU ranges
- Characterize lesions in the vessel wall as either calcified or non-calcified
- Full Vessel Probe capabilities for coronary artery analysis including the Lesion Tool, Vessel Walk, and Cath View
- Key findings classification for consolidated reporting of cardiac workflows
*CT Cardiac Analysis is a Vitrea™ Advanced Visualization application manufactured by CMI.
**SUREPlaque is a seperately licensed application.
Always refer to the Instructions For Use supplied with the product for complete instructions, indications and cautions.
Computed Tomography Clinical Applications
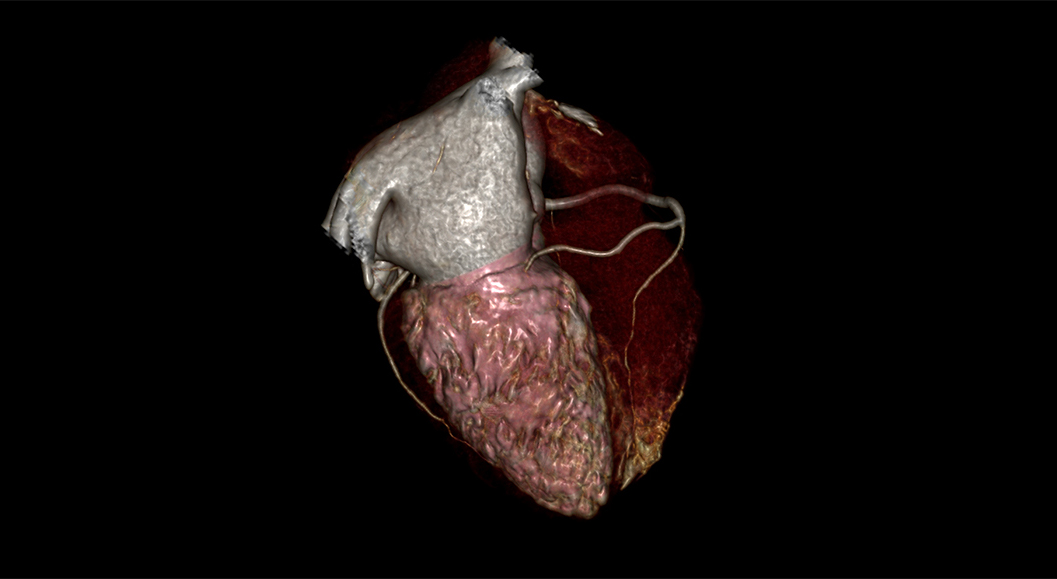
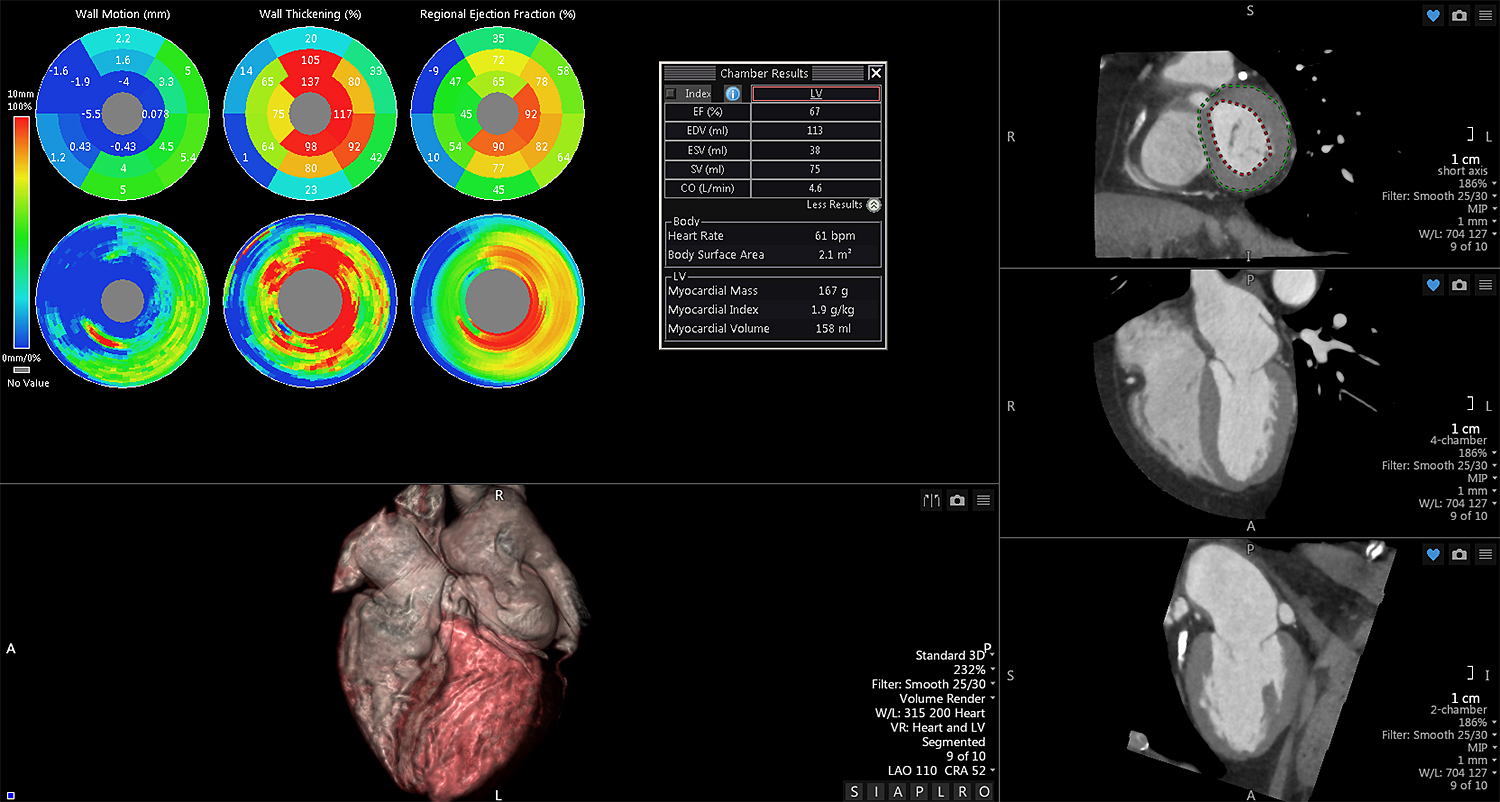
CT Cardiac Functional Analysis
CT Cardiac Functional Analysis (CFA)* utilizes CT images of the heart to assistcardiologists and radiologists in assessing cardiac function for the left ventricle. Clinicians are able to view the cardiac phases dynamically and review the calculated results.
Key Benefits
- Automatic calculation of regional metrics, including: wall motion; percentage of wall thickening, regional ejection fraction; and polar maps with live 3D beating heart visualization
- Automatic segmentation of the heart, left ventricle and myocardium in multiple phases
- Automatic calculation of global metrics, including: end diastolic volume, end systolic volume, stroke volume, ejection fraction, cardiac output, cardiac index, stroke index and myocardial mass
- Short-axis, long-axis and four chamber views of the heart
- Key findings classification for consolidated reporting of all cardiac workflows
*CT Cardiac Functional Analysis is a Vitrea™ Advanced Visualization application manufactured by CMI.
Always refer to the Instructions For Use supplied with the product for complete instructions, indications and cautions
Computed Tomography Clinical Applications
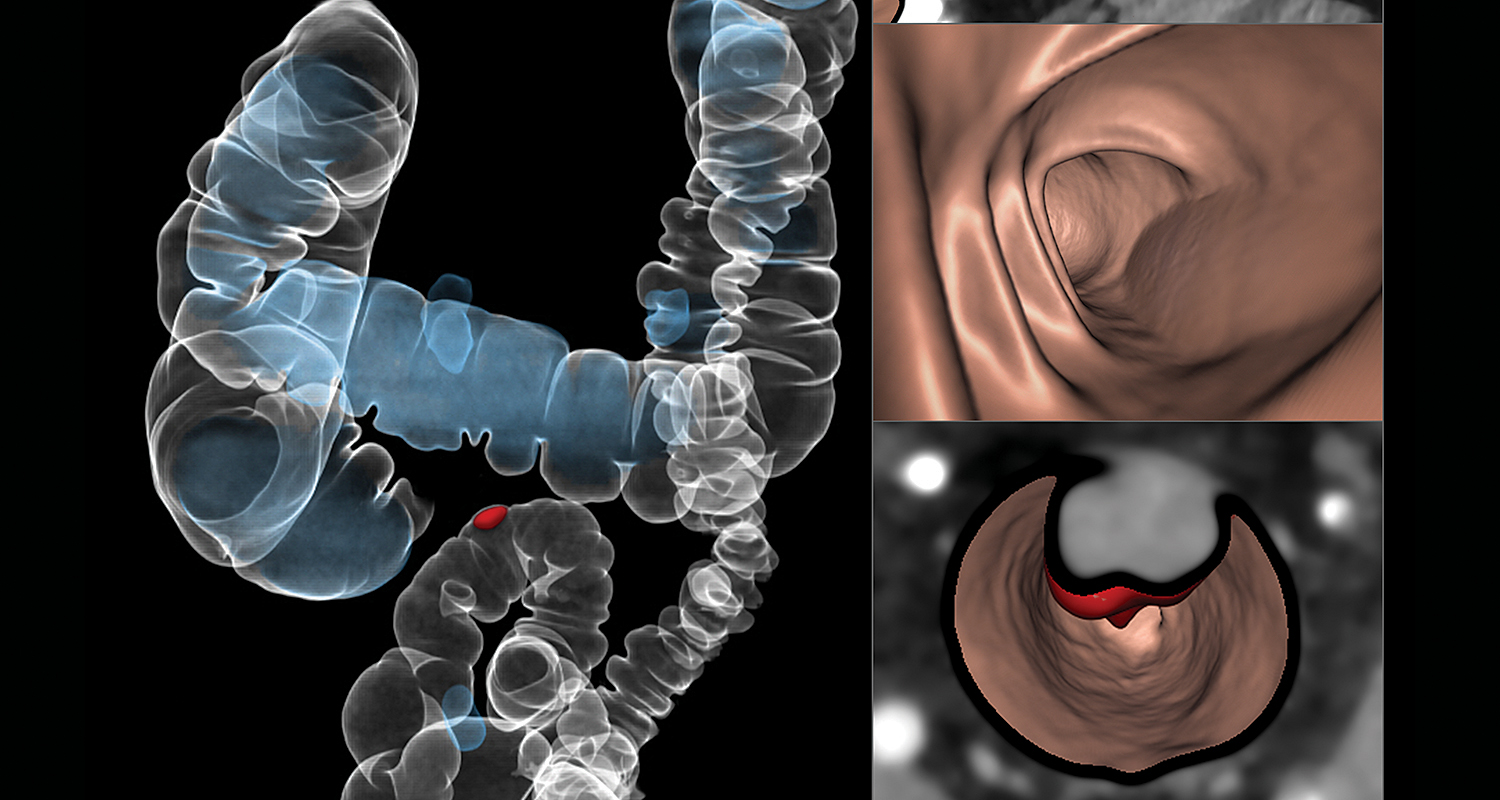
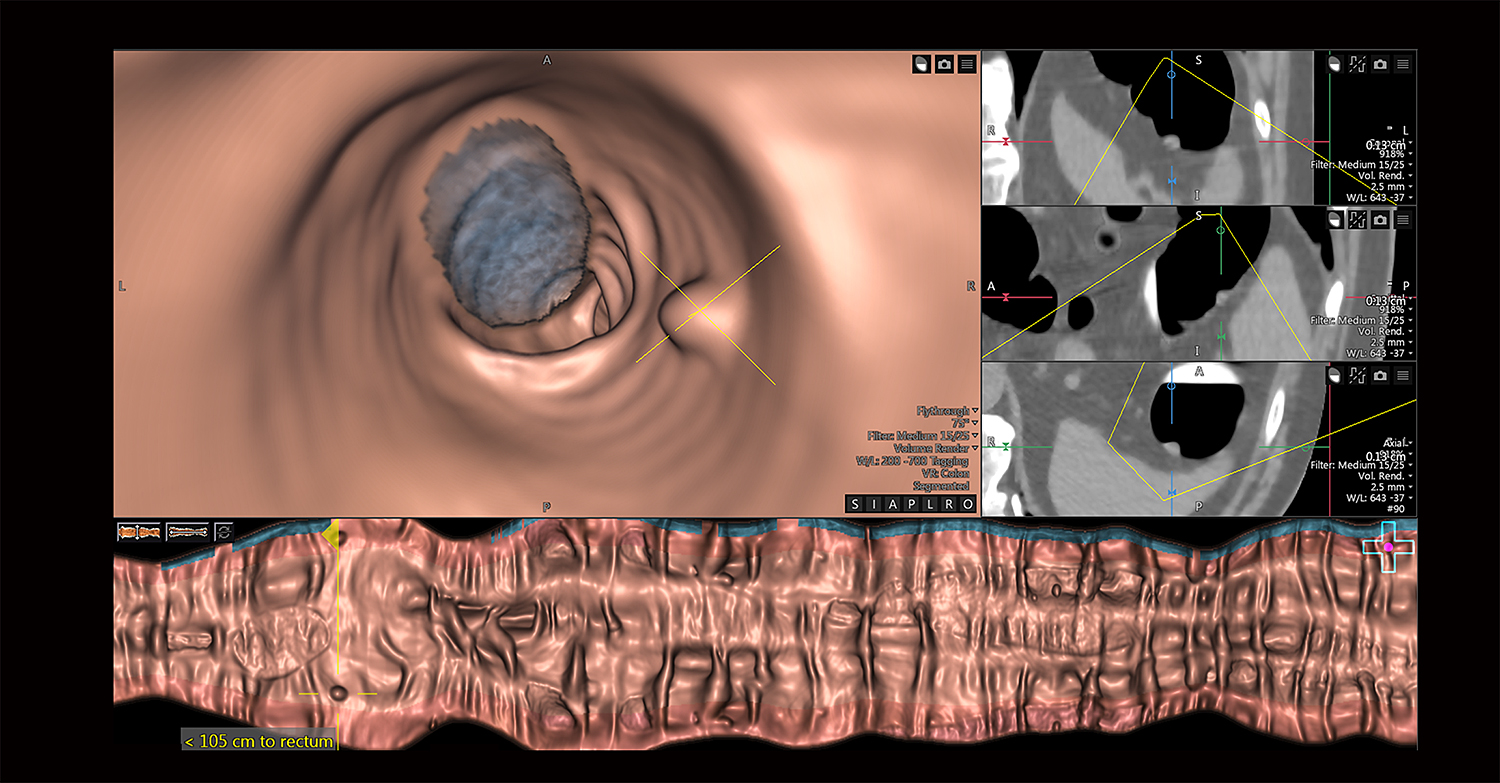
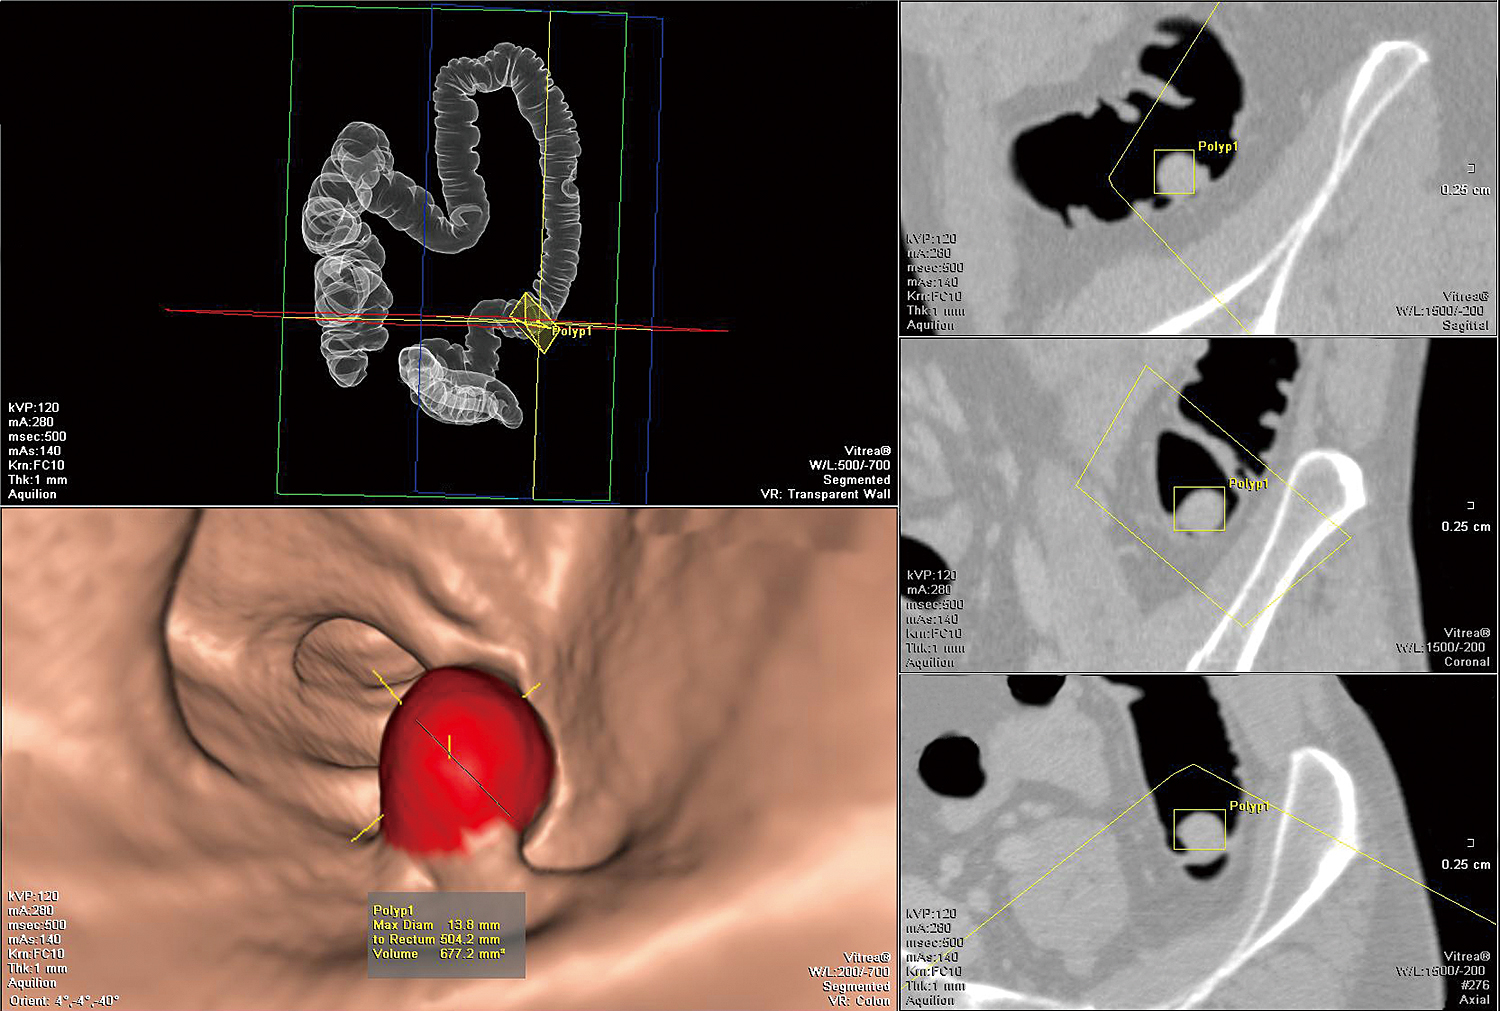
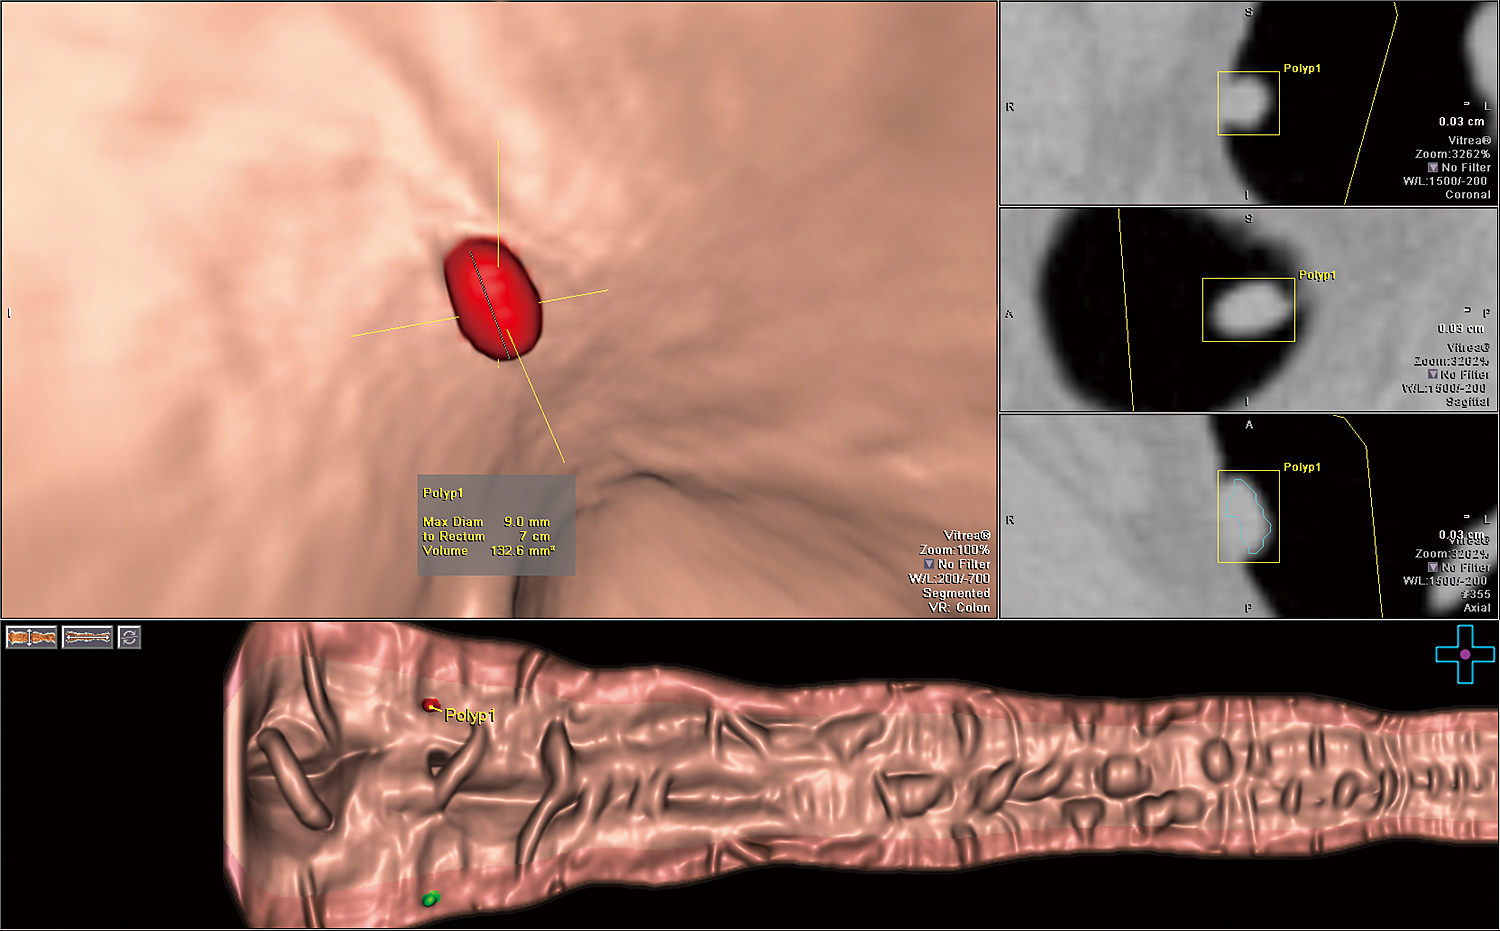
CT Colon Analysis
CT Colon Analysis* provides clinicians with the ability to perform CT colonography. It provides optimized layouts for 2D and 3D examination of the lumen, including tools for quantitative analysis of suspected polyps.
Key Benefits
- Auto-segmentation of the colon with creation of 2D and 3D centerline for simultaneous multiplanar reformatting (MPR) and 3D review
- Single-click polyp segmentation for morphological characterization and quantification of size, density and distance to rectum
- Integrated filet view and endoluminal fly-through
- Polyp assessment and reporting using C-RADS guidelines
- Automatic fluid/stool tagging and subtraction
*CT Colon Analysis is a Vitrea™ Advanced Visualization application manufactured by CMI.
Always refer to the Instructions For Use supplied with the product for complete instructions, indications and cautions.
Computed Tomography Clinical Applications
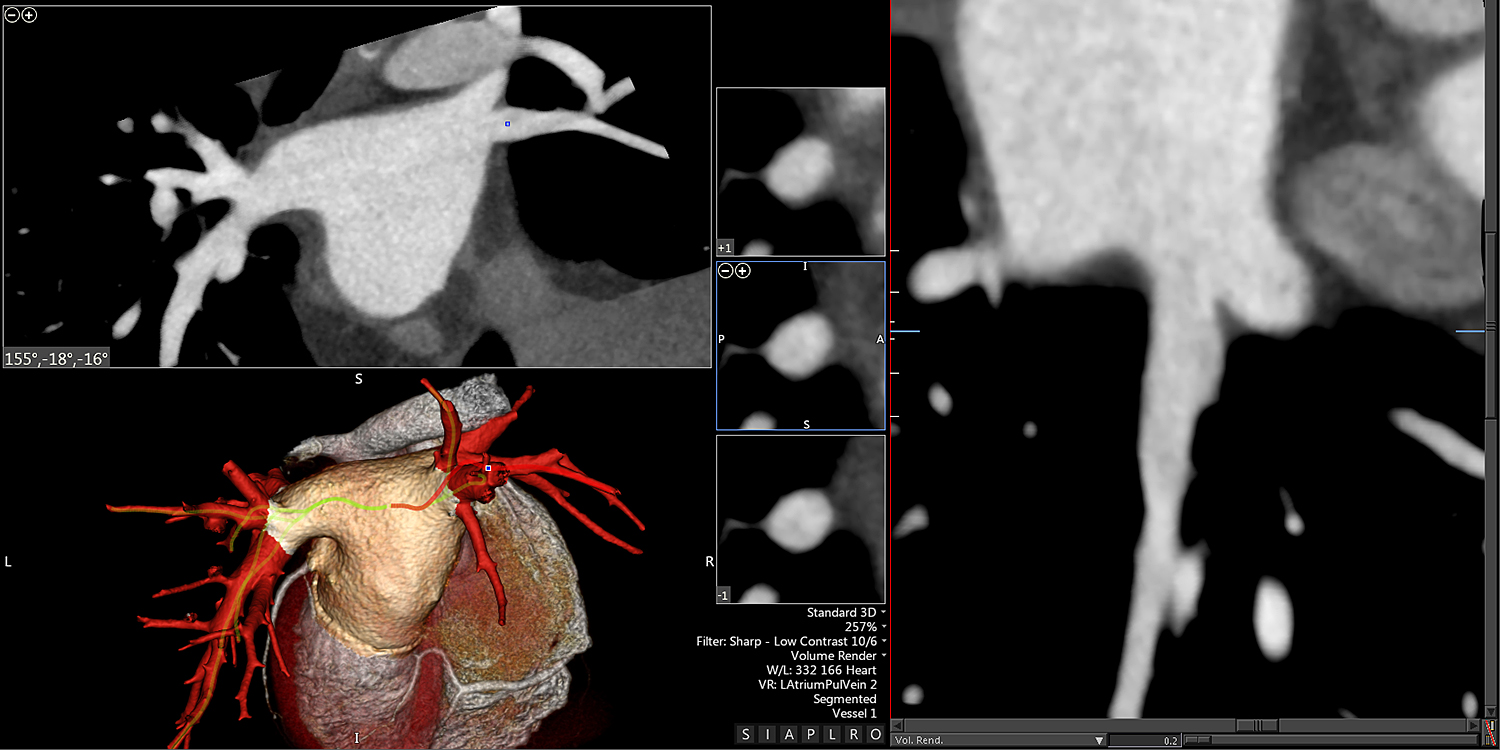
CT EP Planning
CT EP Planning* enables analysis and assessment of the left atrium and pulmonary veins. The application provides optimized 2D and 3D views with tools for quantiative measurements and 3D model export capabilities.
Key Benefits
- Automated segmentation of the left atrium and pulmonary veins
- Automatic centerline and lumen boundaries with 3D fly-through for visualization and measurement of the pulmonary vein ostia
- Ability to export results in a STL file
- Export the 3D model to an EP navigation and mapping system (EnSite™)
*CT EP Planning is a Vitrea™ Advanced Visualization application manufactured by CMI.
Always refer to the Instructions For Use supplied with the product for complete instructions, indications and cautions.
Computed Tomography Clinical Applications
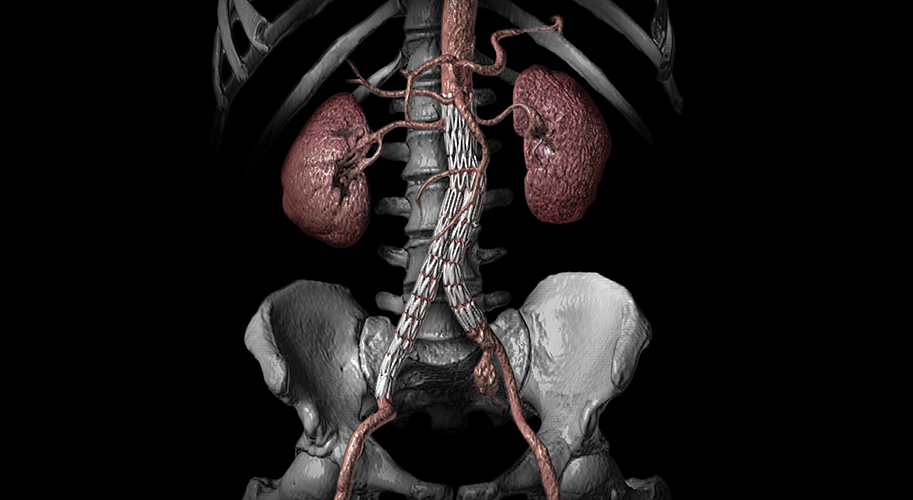
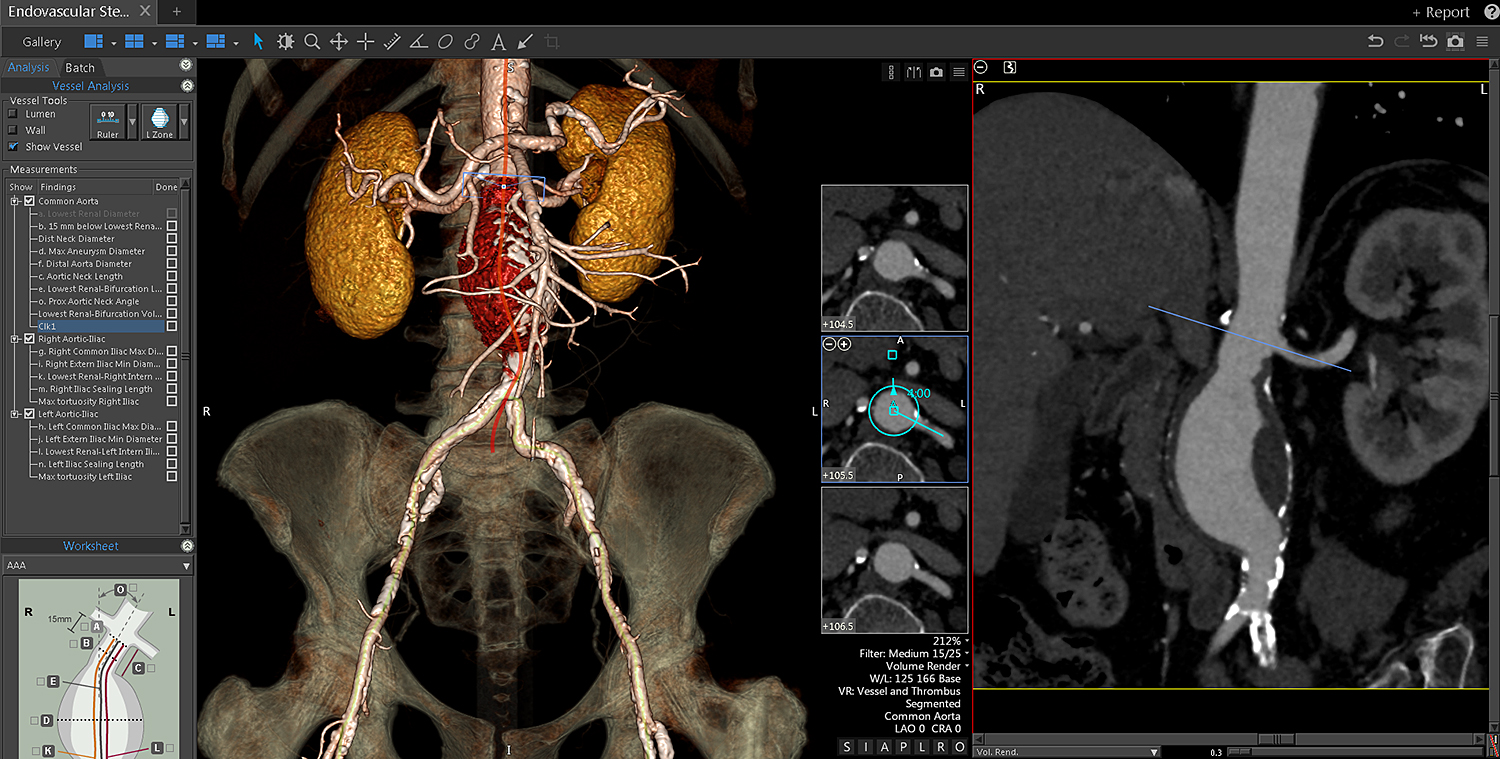
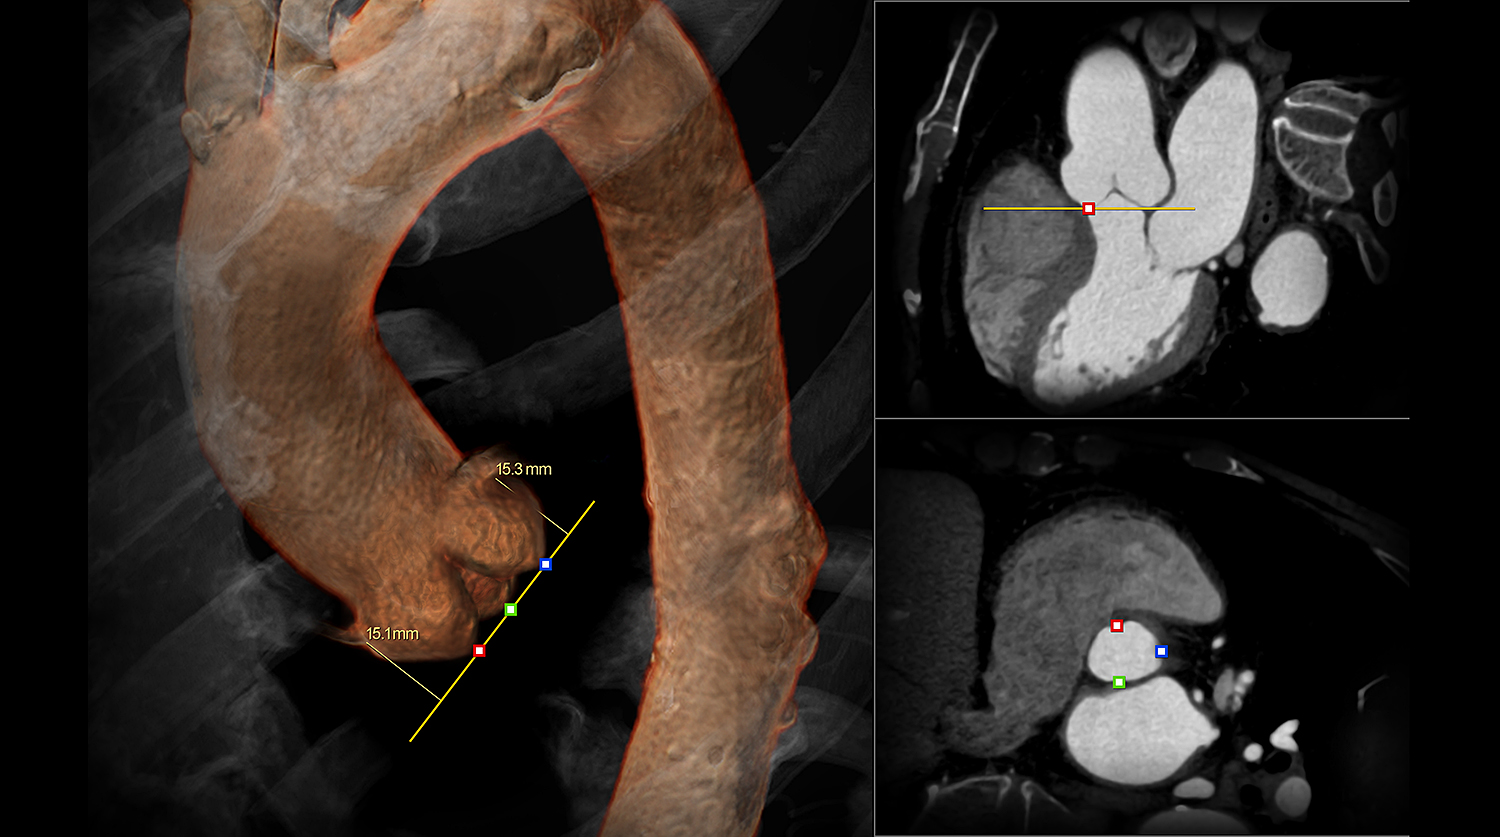
CT Endovascular Stent Planning (EVSP)
CT Endovascular Stent Planning (EVSP)* enables visualization and measurements of aortic vessels for evaluation, treatment and follow-up for aortic vascular disorders. It automates 3D segmentation of the aorta and initializes stent measurements, based on a template provided by stent manufacturers for a highly efficient workflow.
Key Benefits
- Automatic bone segmentation and vessel tracking with centerline and contour editing tools
- User-guided workflow with automated identification of anatomical landmarks and stent-specific endovascular measurements
- Auto-populated reporting worksheet with selected stent template measurements
- Multi-study support for longitudinal comparison
*CT Endovascular Stent Planning is a Vitrea™ Advanced Visualization application manufactured by CMI.
Always refer to the Instructions For Use supplied with the product for complete instructions, indications and cautions.
Computed Tomography Clinical Applications
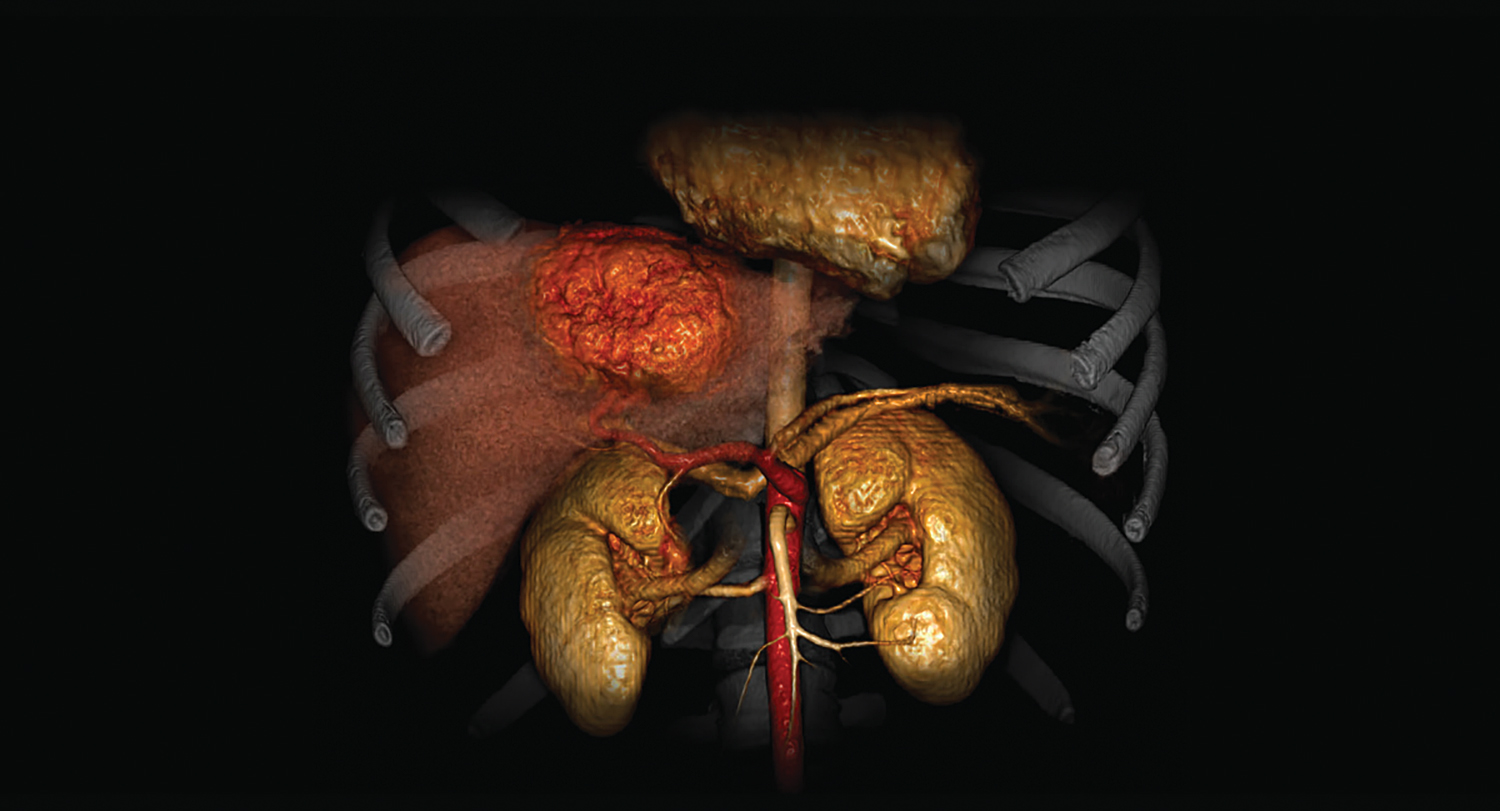
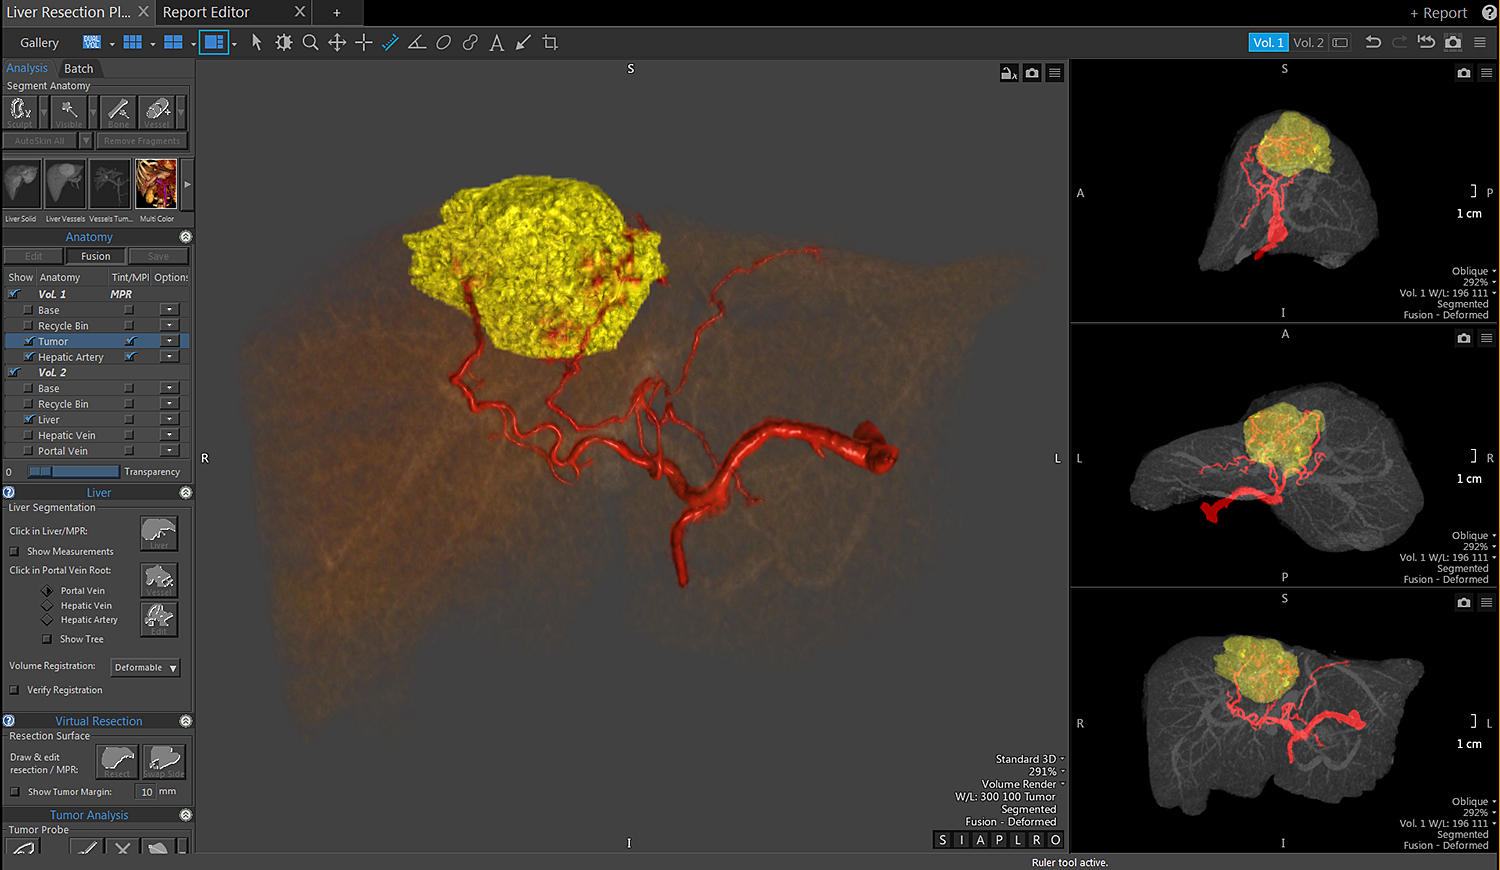
CT Liver Analysis
CT Liver Analysis* provides tools for segmenting and quantifying the liver and liver-related tumors. It provides automatic registration for display of multiple series, optimized screen layouts and quantification tools for routing clinical measurements.
Key Benefits
- Single-click liver and vascular segmentation
- Single-click tumor probe with tumor margin borders viewing in 2D/3D
- Volume fusion support for multiple timed phases
- Resection planning tool to divide the liver into Remnant and Resected Liver and obtain liver volumes
- User selection for standard, rigid or deformable image registration
*CT Liver Analysis is a Vitrea™ Advanced Visualization application manufactured by CMI.
Always refer to the Instructions For Use supplied with the product for complete instructions, indications and cautions.
Computed Tomography Clinical Applications
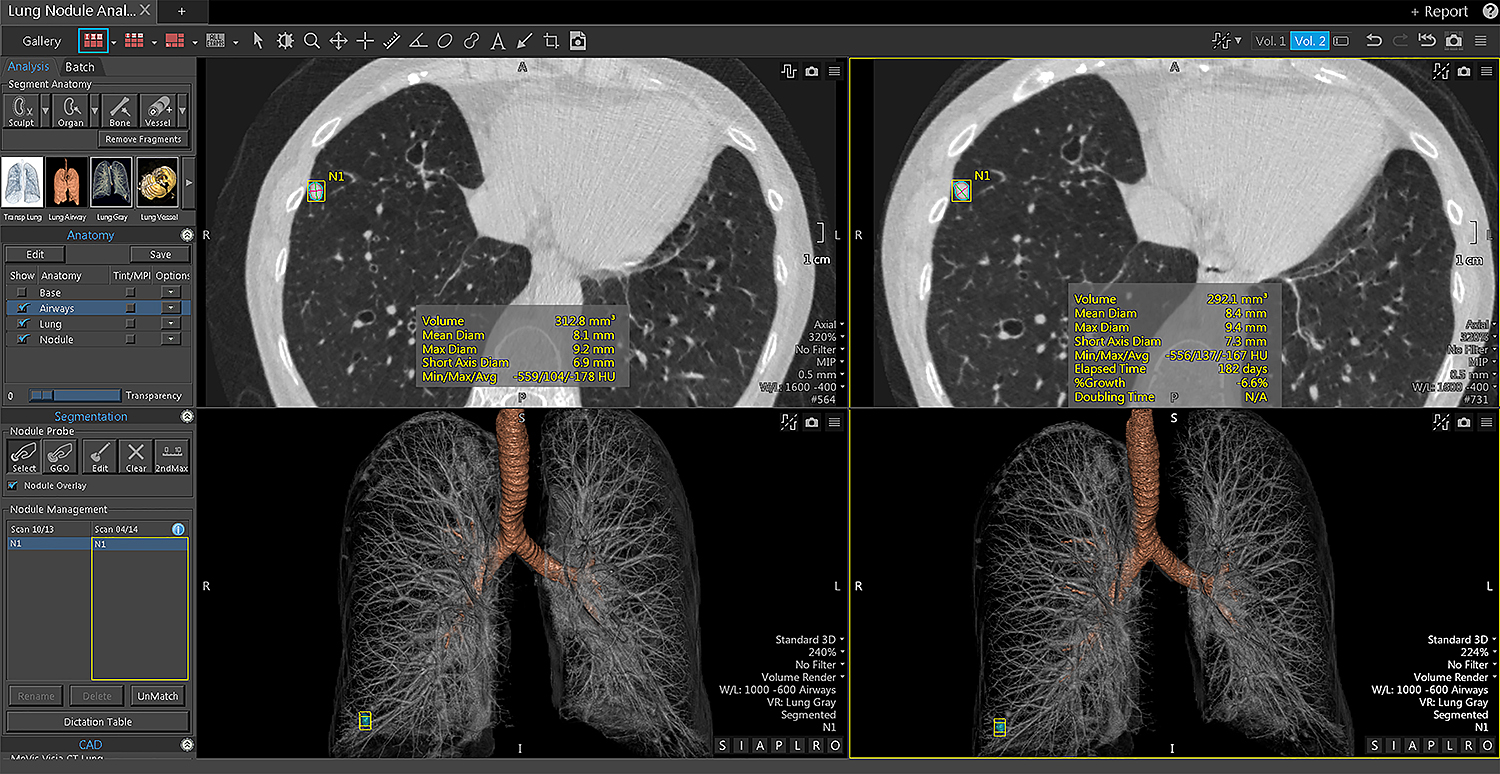
CT Lung Analysis
CT Lung Analysis* aids in measuring and characterizing lung nodules. The interface and automated tools help to efficiently determine growth patterns and compose comparative reviews.
Key Benefits
- Automated segmentation of lung and airways with expert presets for visualization
- Single-click lung nodule segmentation tools to include solid nodules and ground glass opacity (GGO) nodules
- Quantification of lung nodules with nodule growth and doubling times in comparison studies
- Streamlined workflow transfers lung nodule findings to your site’s existing PowerScribe® 360 deployment
- Additional software offerings for Lung Screening Initiatives
*CT Lung Analysis is a Vitrea™ Advanced Visualization application manufactured by CMI.
Always refer to the Instructions For Use supplied with the product for complete instructions, indications and cautions.
Third party marks are property of their respective owner.
Computed Tomography Clinical Applications
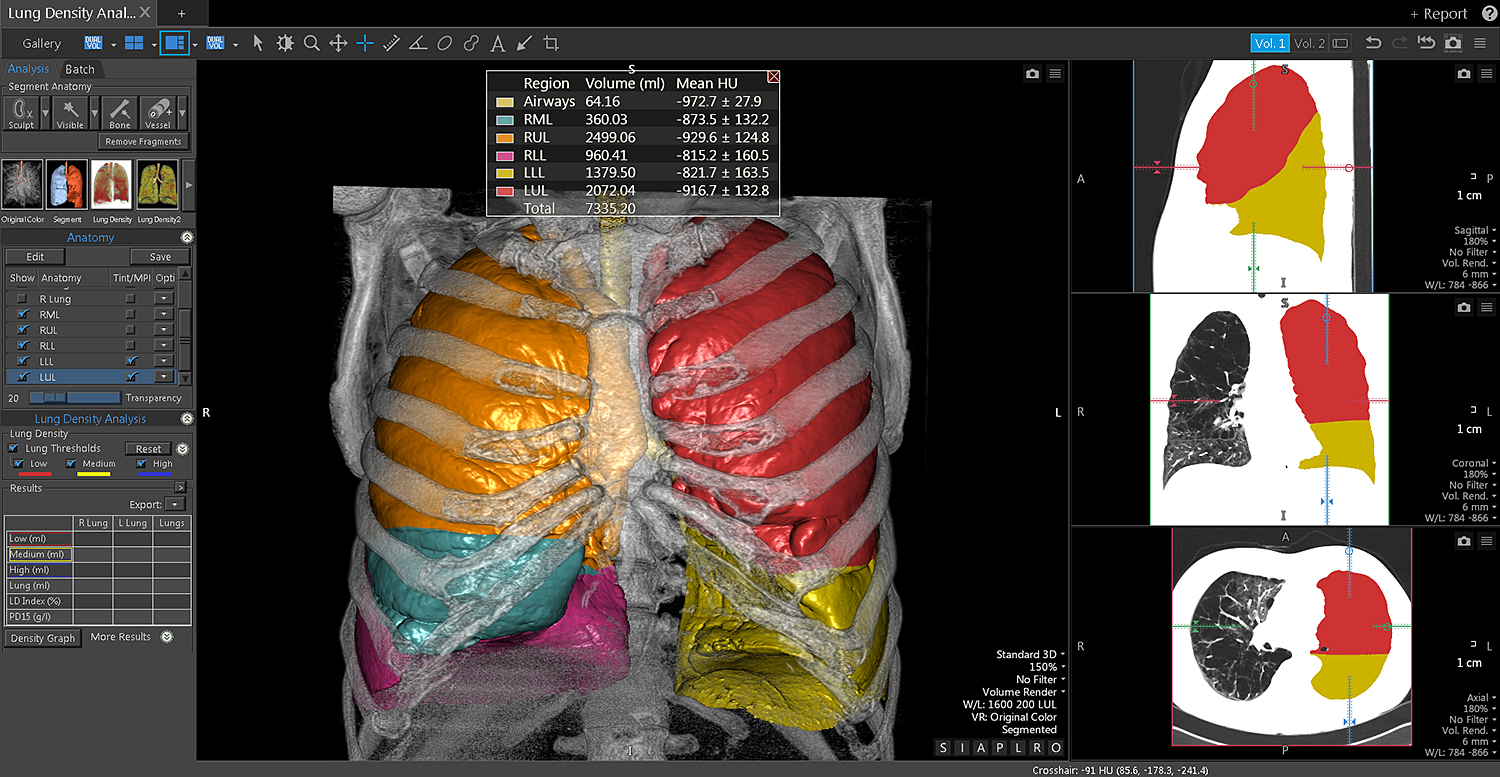
CT Lung Density Analysis
CT Lung Density Analysis* software provides CT values for pulmonary tissue from CT thoracic datasets. Three dimensional (3D) segmentation of the left lung and right lung, volumetric analysis, density evaluations and reporting tools are integrated in a specific workflow to offer the physician quantitative support for diagnosis and follow-up evaluation of lung tissue images.
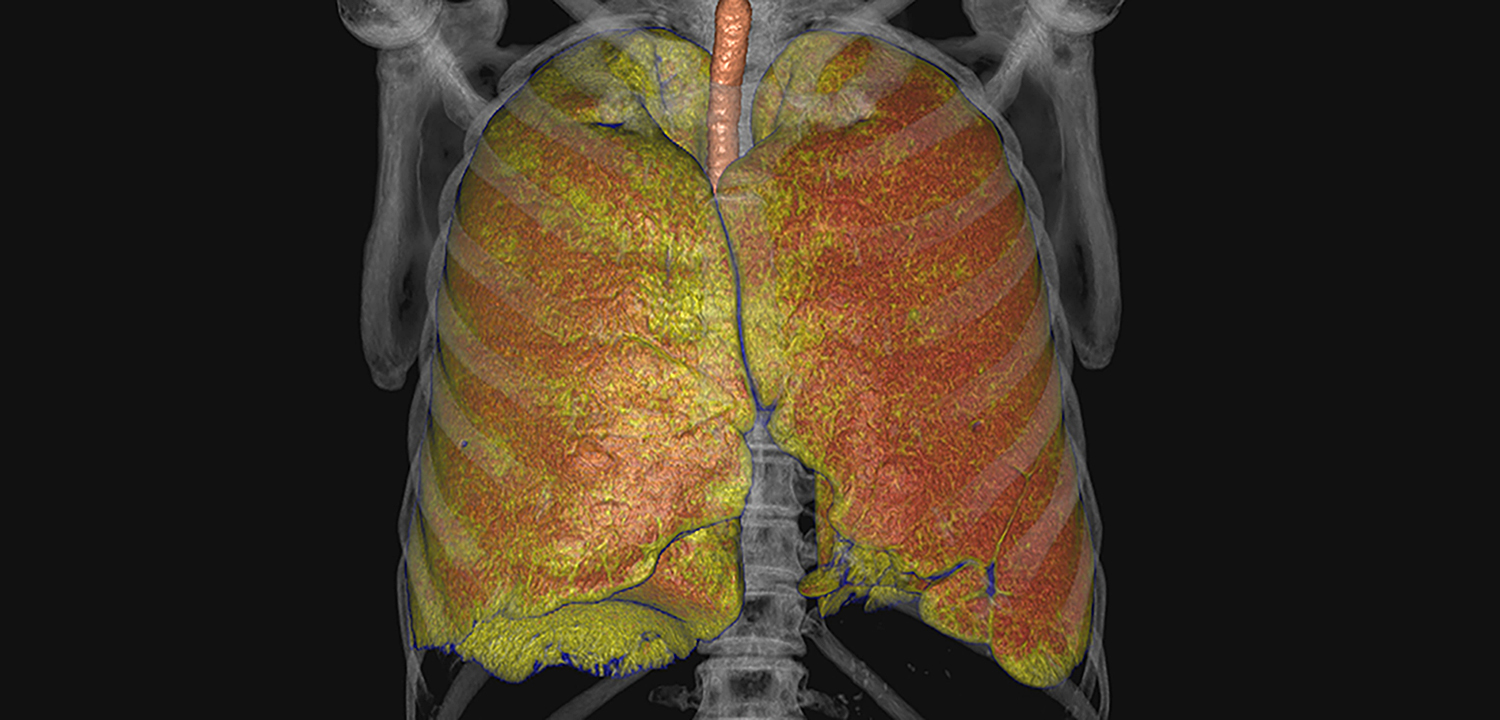
Key Benefits
- Aids in characterization of areas of low attenuation within the lungs and provides quantifiable controls and renderings for communication with referring clinicians
- Lung density result quantification with HU density range, volume measurements, lung density index and the PD 15% measurement
- Improved image quality for noisy images with built-in denoising function
*CT Lung Density Analysis is a Vitrea™ Advanced Visualization application manufactured by CMI.
Always refer to the Instructions For Use supplied with the product for complete instructions, indications and cautions.
Computed Tomography Clinical Applications
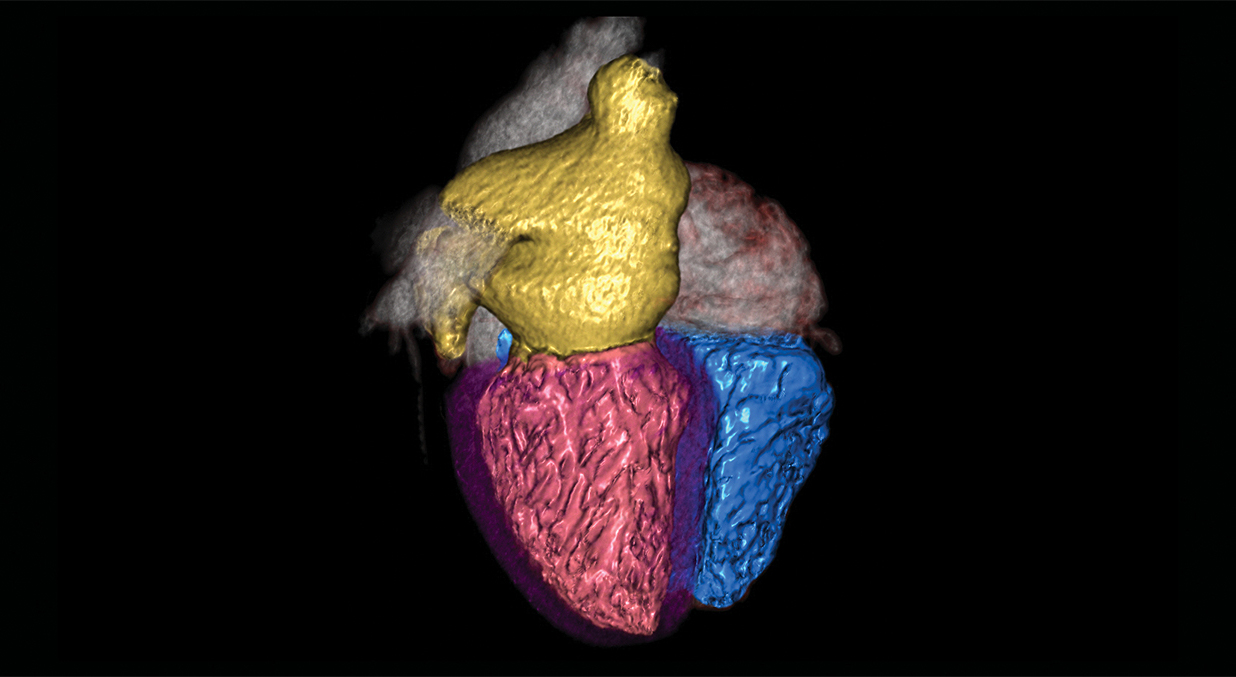
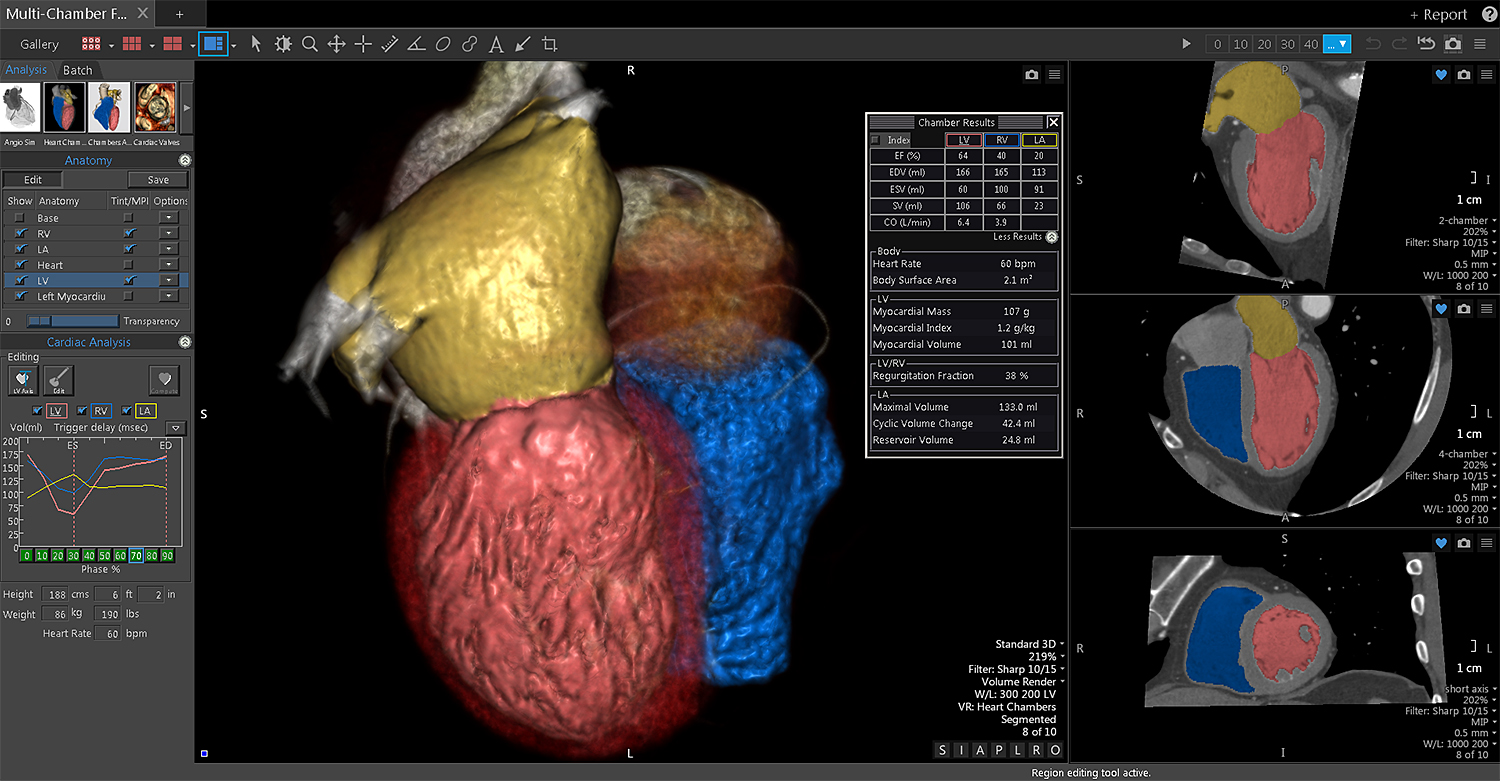
CT Multi-Chamber Cardiac Functional Analysis
CT Multi-Chamber CFA* utilizes CT images of the heart to assist cardiologists and radiologists in assessing cardiac function of the heart’s individual chambers. It allows for the visualization of a beating heart. CT Multi-Chamber CFA computes functional measurements, such as stroke index, stroke volume, ejection fraction and cardiac output.
Key Benefits
- Semi-automatic segmentation of left atrium (LA), right ventricle (RV), left ventricle (LV) and myocardium, including identification of long axis and mitral valve boundaries across multiple phases
- Automatic calculation of RV/LV End Diastolic Volume (EDV), End Systolic Volume (ESV), Stroke Volume (SV), Cardiac Output (CO), 3-point LA metrics, LV/RV regurgitation fraction, cardiac index and myocardial mass
- Calculation of regional metrics including wall motion, percentage of wall-thickening, regional ejection fraction and polar plots
- Key findings classification for consolidated reporting of cardiac workflows
*CT Multi-Chamber Cardiac Functional Analysis is a Vitrea™ Advanced Visualization application manufactured by CMI.
Always refer to the Instructions For Use supplied with the product for complete instructions, indications and cautions.
Computed Tomography Clinical Applications
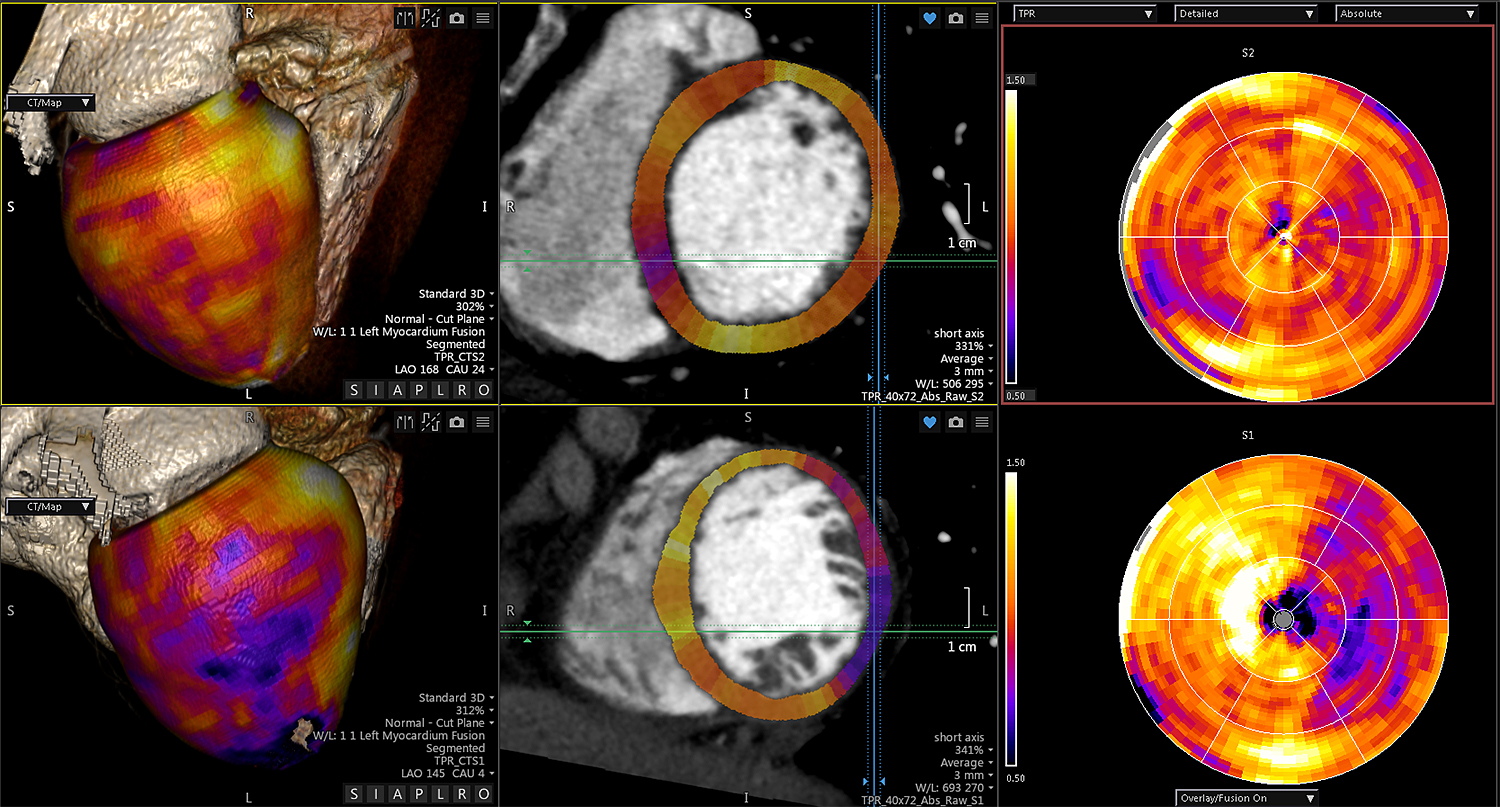
CT Myocardial Perfusion
CT Myocardial Perfusion* enables the visualization and analysis of perfusion deficits in the myocardium. Semi-automated segmentation and registration are available in a streamlined workflow.
Key Benefits
- Semi-automatic chamber and myocardium segmentation
- Qualitative measurements, including Myocardial Mass, Myocardial Volume and Hounsfield Unit (HU) attenuation
- Polar map plots (contrast, transmural perfusion ratio, perfusion index) highlighting potential myocardium defects
- Defect scoring tool provides users an alternative way to:
- Determine size of hypo-dense regions
- Calculate percent of affected myocardium
*CT Myocardial Perfusion is a Vitrea™ Advanced Visualization application manufactured by CMI.
Always refer to the Instructions For Use supplied with the product for complete instructions, indications and cautions.
Computed Tomography Clinical Applications
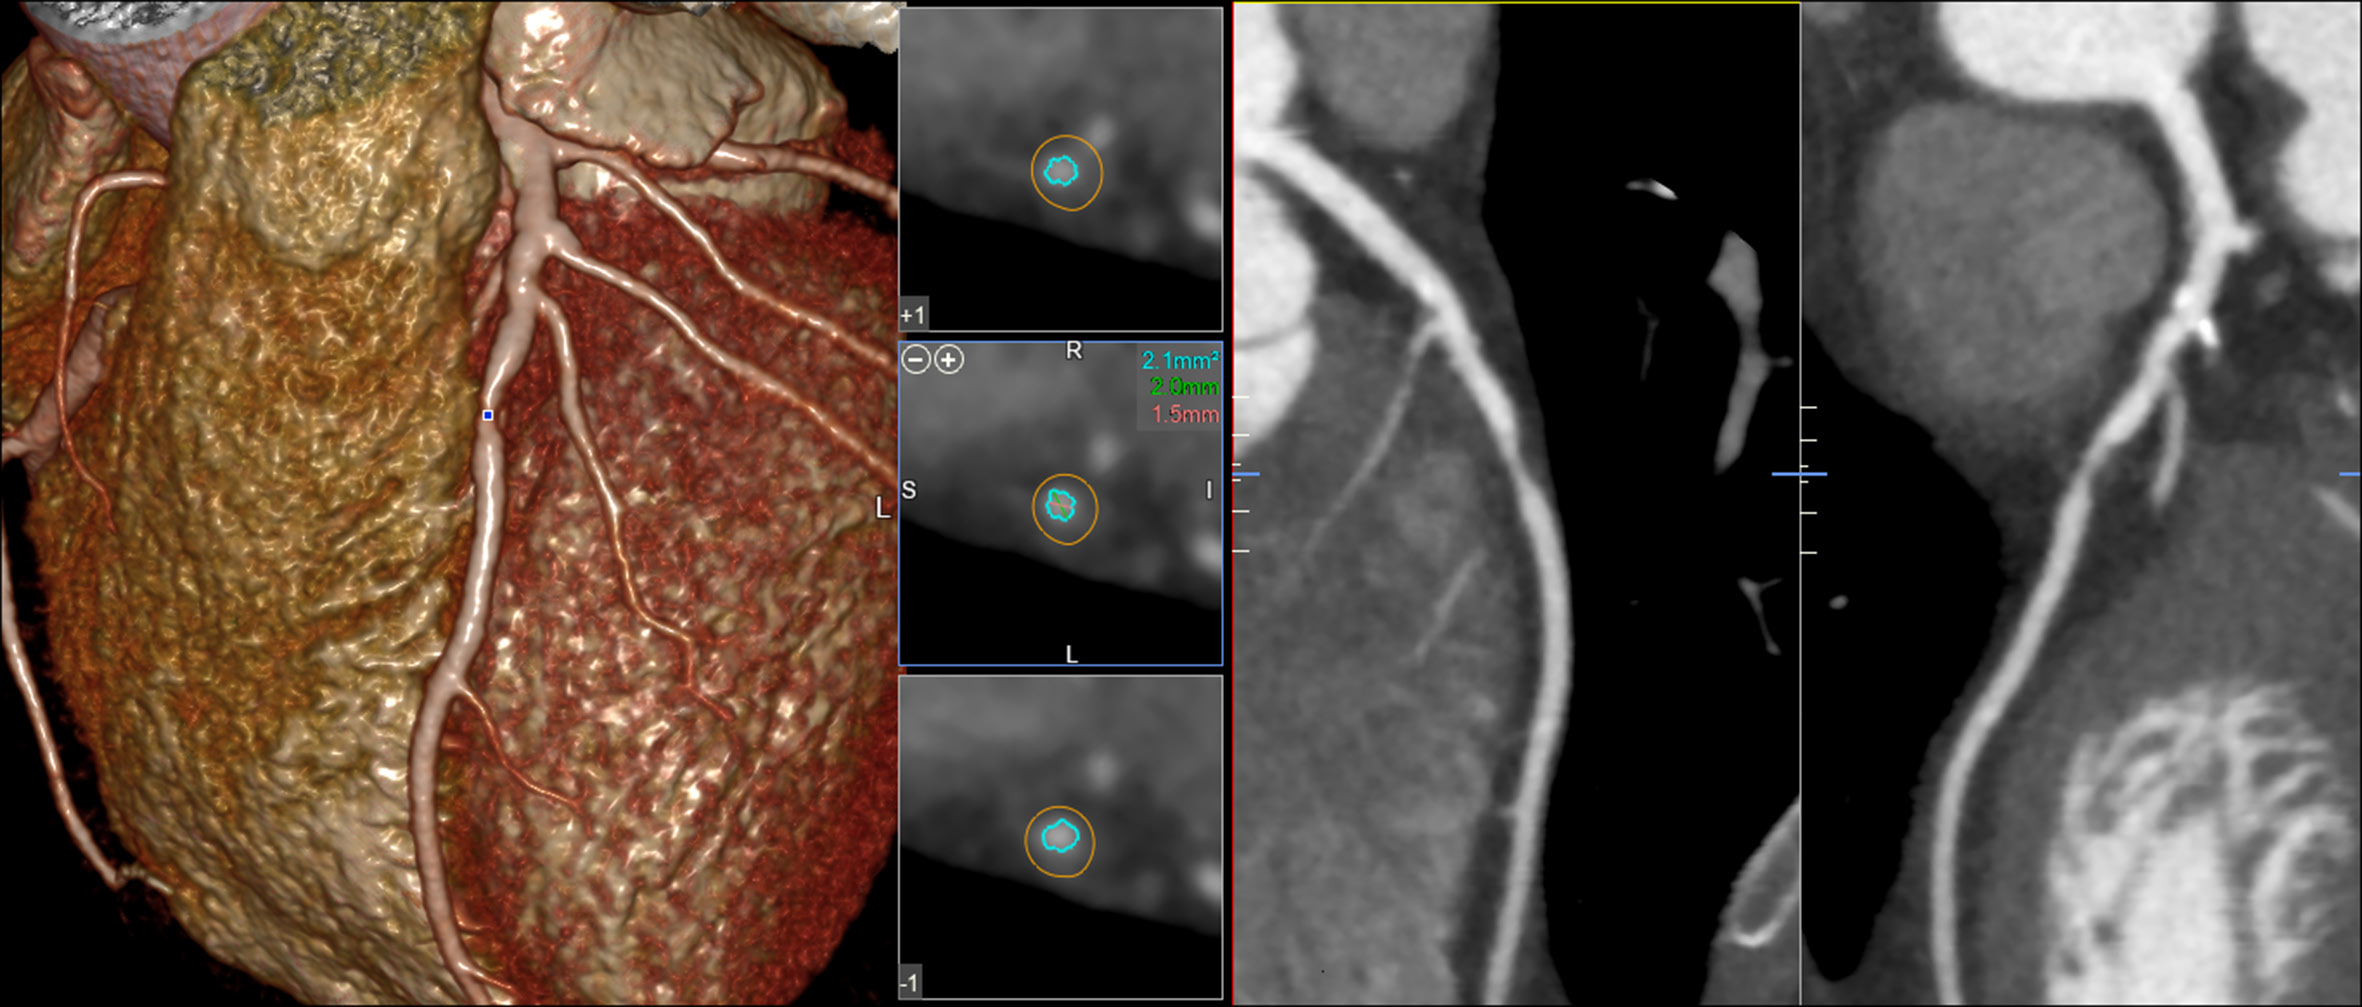
CT SUREPlaque™
CT SUREPlaque* provides the visualization and measurement of vessel walls and plaque characteristics in arterial vessels using color defined Hounsfield Unit (HU) ranges through a streamlined workflow. It can assist in the stratification of patients identified to have atherosclerosis.
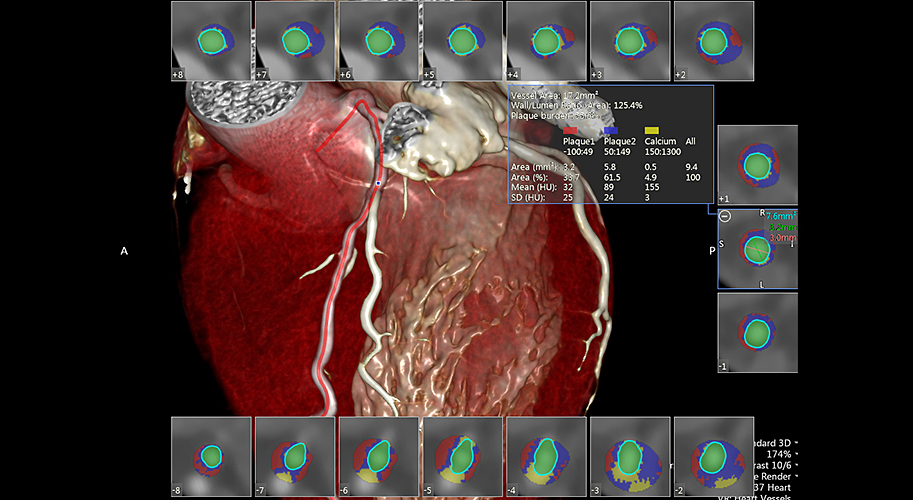
Key Benefits
- SUREPlaque tools assist clinicians in evaluating the characteristics inside blood vessels:
- Quantify plaque burden and coronary remodeling non-invasively
- Visualize coronary vessel anatomy and disease with ease using defined HU ranges
- Characterize a lesion in the vessel wall as either calcified or non-calcified
- Single-click segmentation with automatic centerline and lumen boundaries
- Automatic measurement and display of: lumen area and diameter; plaque area; plaque burden; ratio of wall area and lumen area; plaque volume; and plaque index
*CT SUREPlaque is a Vitrea™ Advanced Visualization application manufactured by CMI.
Always refer to the Instructions For Use supplied with the product for complete instructions, indications and cautions.
Computed Tomography Clinical Applications
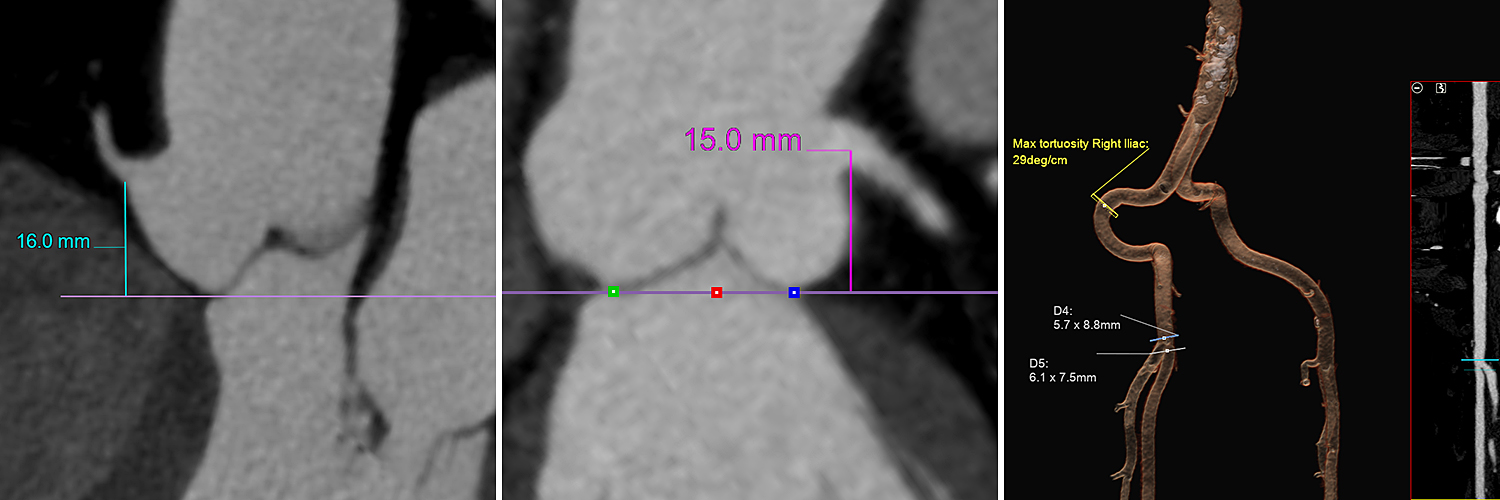
CT Transcatheter Aortic Valve Replacement (TAVR)
CT Transcatheter Aortic Valve Replacement (TAVR)* Planning assists with the assessment of the aortic valve and in pre-operative planning and post-operative evaluation of transcatheter aortic valve replacement procedures.
Key Benefits
- Ability to load multiple volumes or series, allowing users to analyze and perform measurements in different phases of the cardiac cycle with combined reporting
- Automatic segmentation of aortic root, aortoiliac vessels with multiple viewing options including volume rendering, MIP, MPR, curved and straightened vessel MPR views
- Custom reporting templates with user guided automation assists with analysis and necessary measurements including:
- Annulus with diameters, area and circumference
- Right and left ostium measurements
- Sinotubular Junction (STJ) diameter and size
- Sinus of Valsalva width and height
- Access route diameters, area and tortuosity
- Flexibility to enable planning for transfemoral, subclavian and transapical delivery approaches with display of C-Arm angles for device placemen
*CT Transcatheter Aortic Valve Replacement (TAVR) is a Vitrea™ Advanced Visualization application manufactured by CMI.
Always refer to the Instructions For Use supplied with the product for complete instructions, indications and cautions.
Computed Tomography Clinical Applications
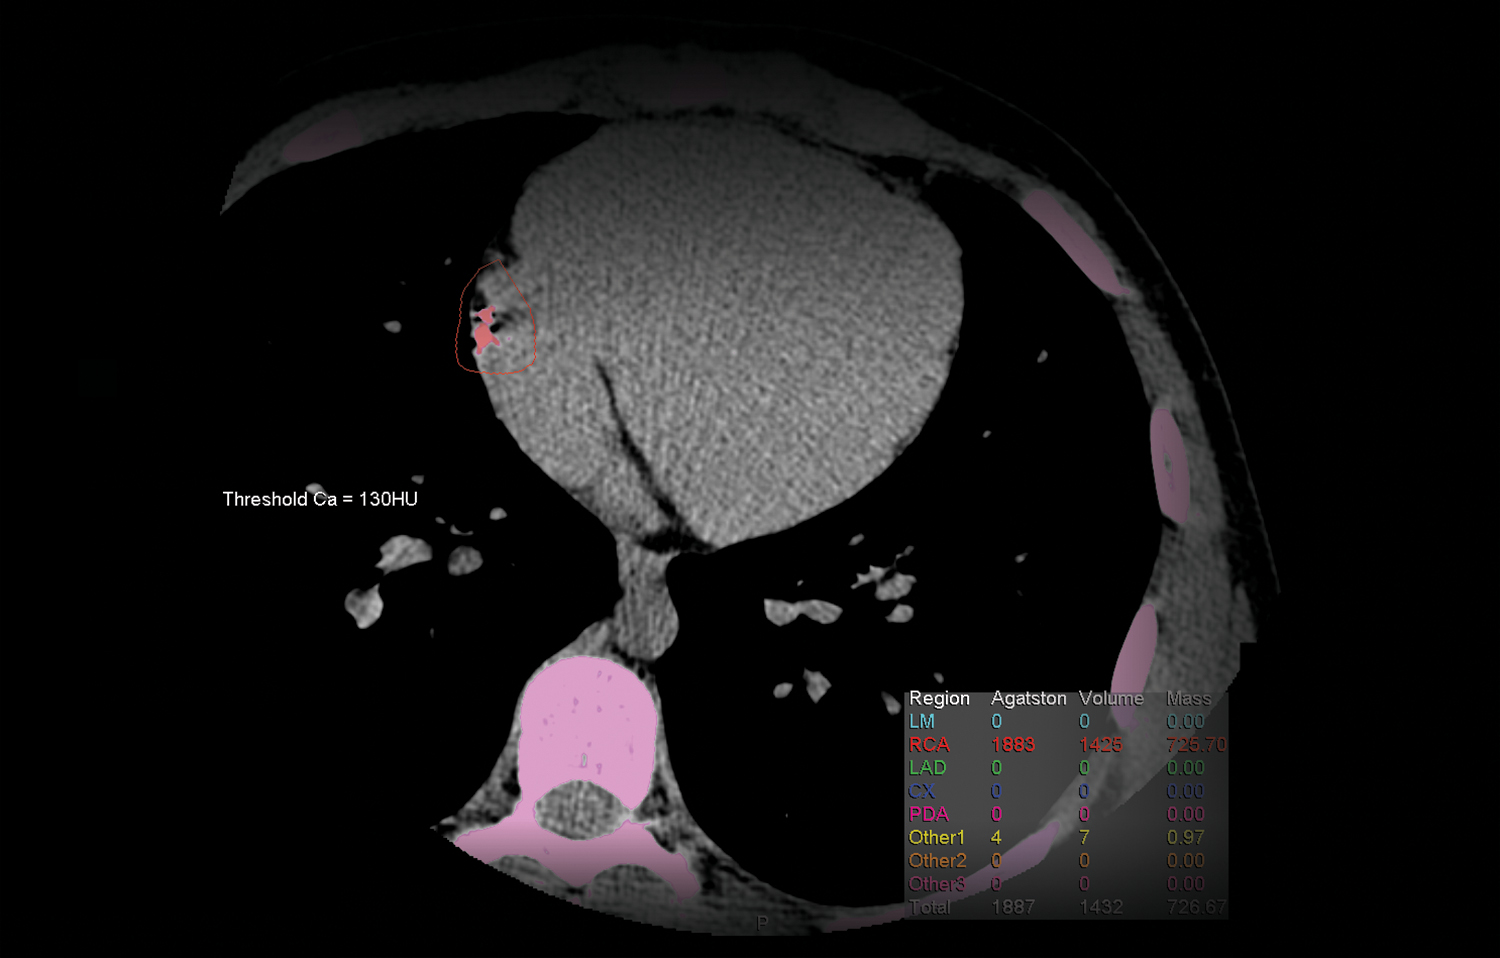
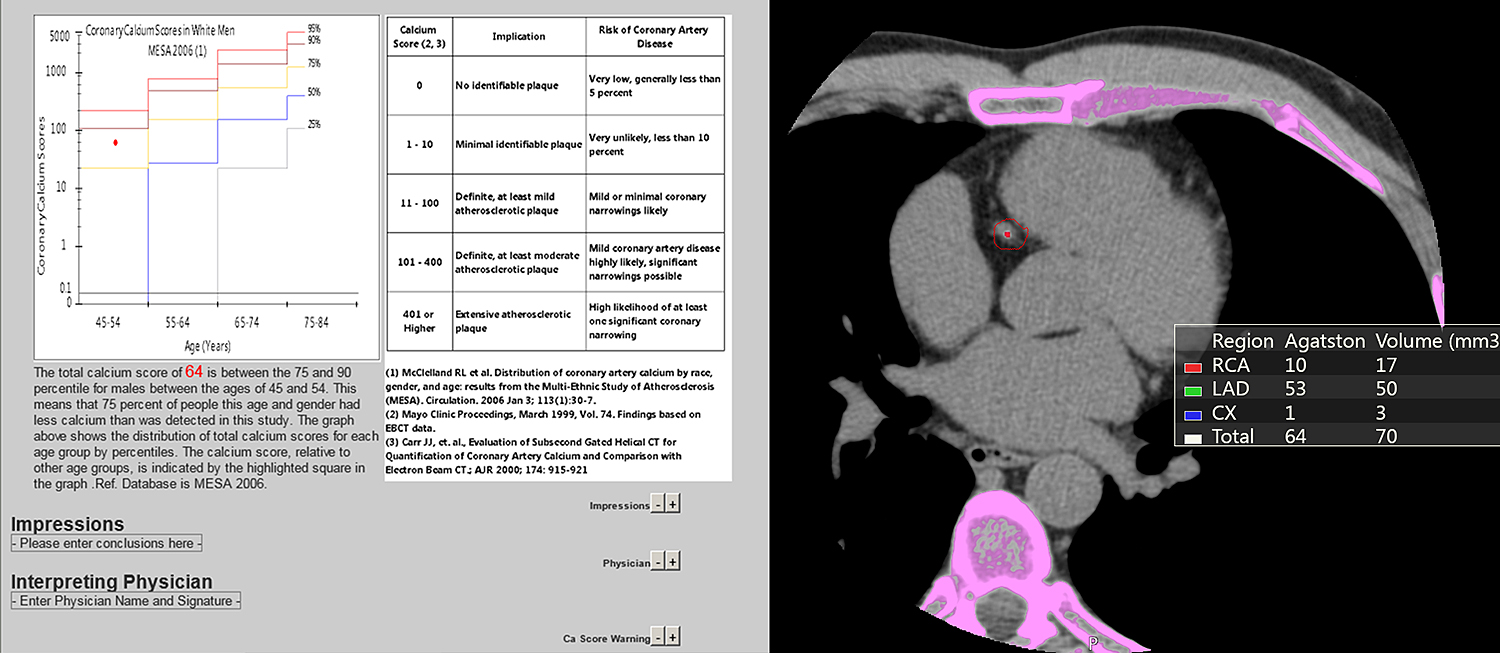
CT VScore™
CT VScore* is a calcium scoring application that provides the ability to visualize, measure and create a report of coronary calcification and calculate the calcium score using a non-contrast cardiac CT exam. It enables clinical reporting for coronary risk assessment.
Key Benefits
- 2D and 3D visualization
- Report template autofills user selected scores and includes snapshots and graphs that can be exported
- Calculation of calcium score using Agatston, Volume or Mass
- The calcium percentile is displayed on a graph that compares the patient’s calcified plaque burden to that of other asymptomatic men or women of the same age range and/or ethnic group
*CT VScore is a VitreaTM Advanced Visualization application manufactured by CMI.
Third party marks are property of their respective owner.
Always refer to the Instructions For Use supplied with the product for complete instructions, indications and cautions.
Computed Tomography Clinical Applications
iCAD VeraLook® CT Colon CAD
iCAD’s VeraLook CT Colon CAD generates a list of polyps within the colon using computer-aided detection algorithms. When iCAD VeraLook CT Colon CAD is integrated in CT Colon Analysis, it increases the speed and ease of locating and analyzing the identified polyps.
Computed Tomography Clinical Applications
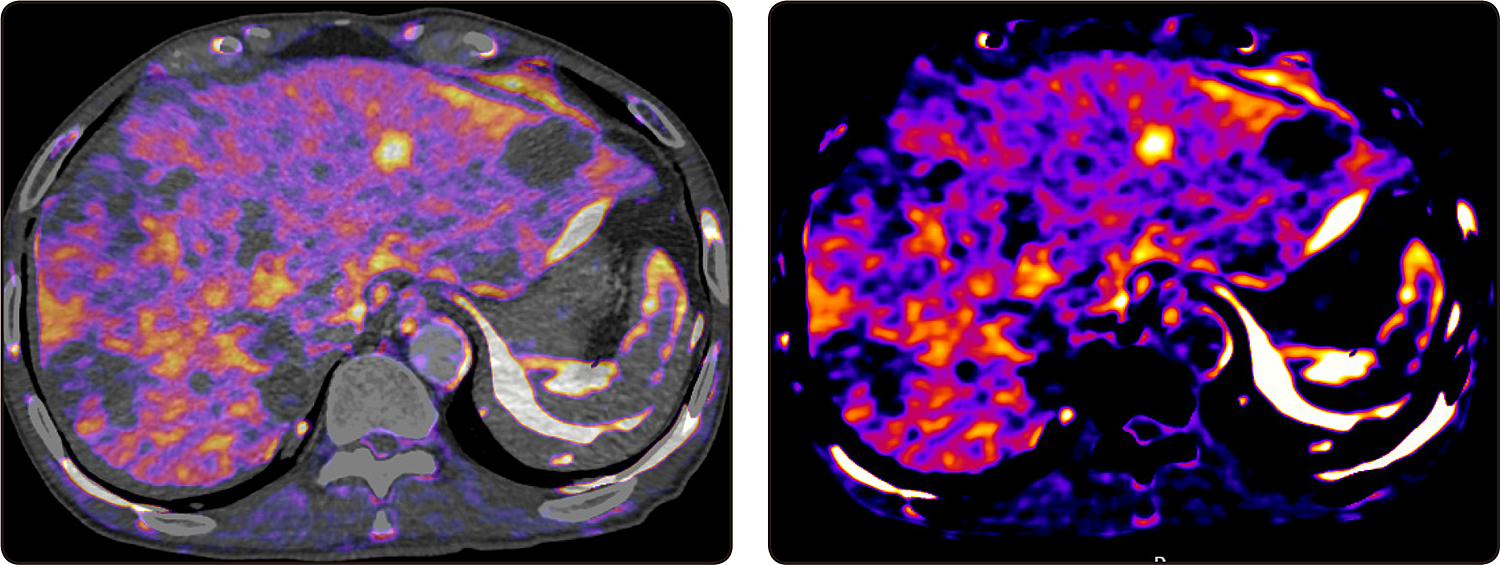
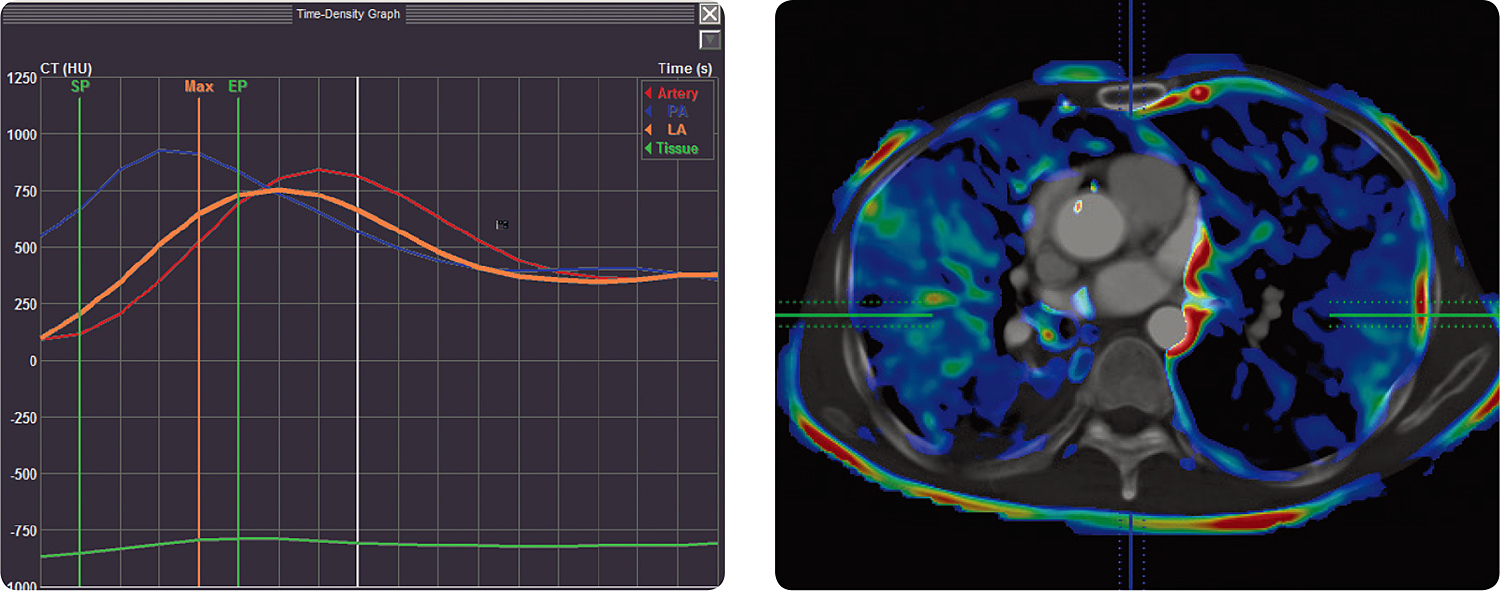
CT Body Perfusion
CT Body Perfusion 4D* enables whole-organ functional assessment. Parametric maps, based on the contrast flow through an organ, provide additional information to aid clinical decision-making. Views and layouts for dynamic display of images are created throughout the duration of the scan.
Key Benefits
- Single-input organ workflow for display of Arterial Flow (AF) map
- Dual-input lung workflow for display of Pulmonary Flow (PF), Arterial Flow (AF) and Pulmonary Perfusion Index (PI) maps
- Dual-input liver workflow for display of Arterial Flow (AF), Portal Flow (PF) and Hepatic Perfusion Index (PI) maps
- Deformable registration and motion correction
- Patlak Plot method for display of Arterial Flow maximum slope, Patlak Equivalent Blood Volume and Patlak Flow
*CT Body Perfusion 4D is a Vitrea™ Advanced Visualization application manufactured by CMI.
Always refer to the Instructions For Use supplied with the product for complete instructions, indications and cautions.
Computed Tomography Clinical Applications
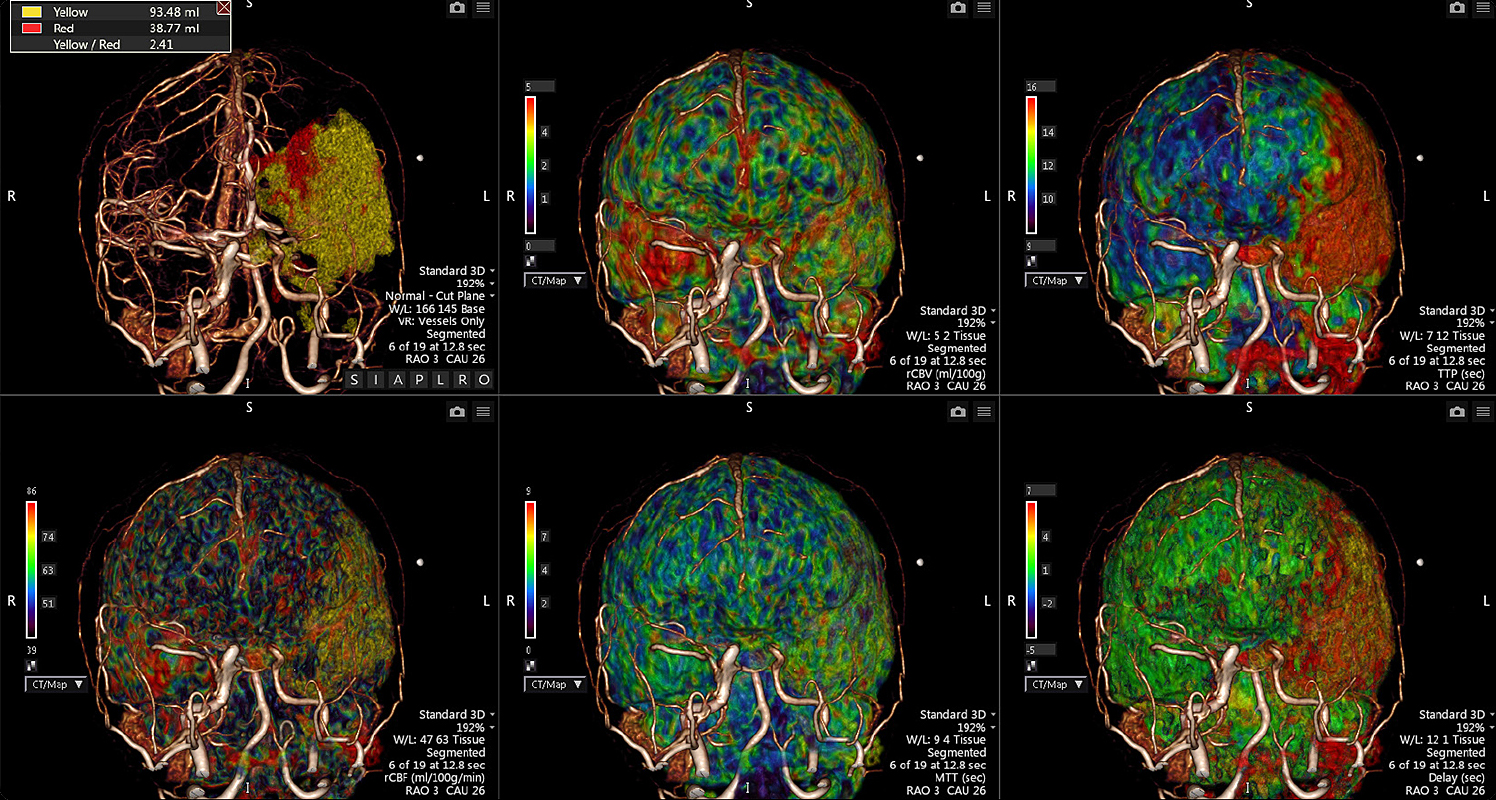
CT Brain Perfusion 4D
CT Brain Perfusion 4D* aids with assessing the whole brain and evaluating perfusion deficits by displaying 4D-DSA (digital subtraction angiography) views of blood flow in the vessels and 3D perfusion maps. It supports the physician in visualizing the apparent blood perfusion in brain tissue affected by acute stroke. Automated tools help to efficiently visualize anatomy and pathology.
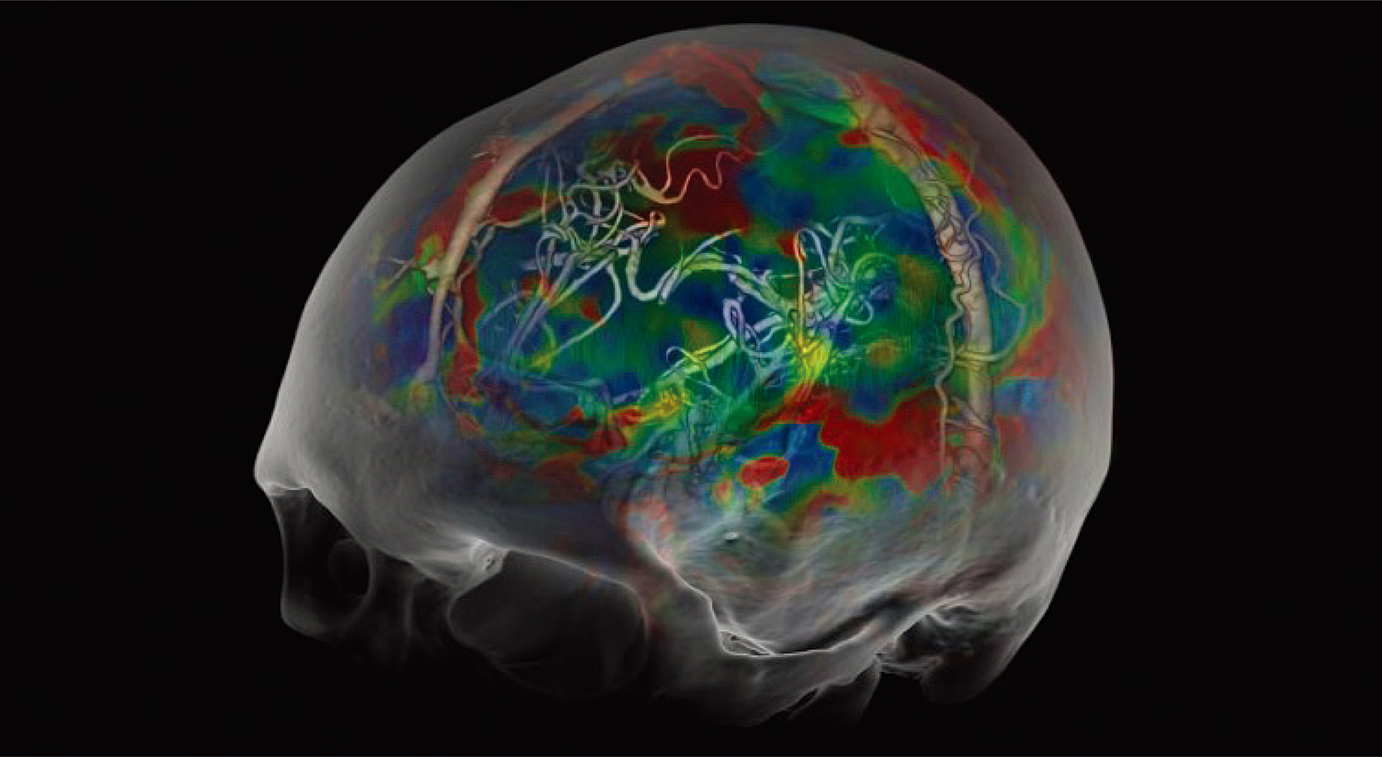
Key Benefits
- Automatic calculation of quantitative brain perfusion results:
- Regional Cerebral Blood Volume (rCBV)
- Mean Transit Time (MTT)
- Regional Cerebral Blood Flow (rCBF)
- Time-to-Peak of tissue response curve (TTP)
- Delay of tissue response curve
- Single-view Summary Map for communicating the perfusion results
- 4D cine of the DSA view for visualizing the flow of contrast through the vessels
*CT Brain Perfusion 4D is a Vitrea™ Advanced Visualization application manufactured by CMI.
Always refer to the Instructions For Use supplied with the product for complete instructions, indications and cautions.
Computed Tomography Clinical Applications
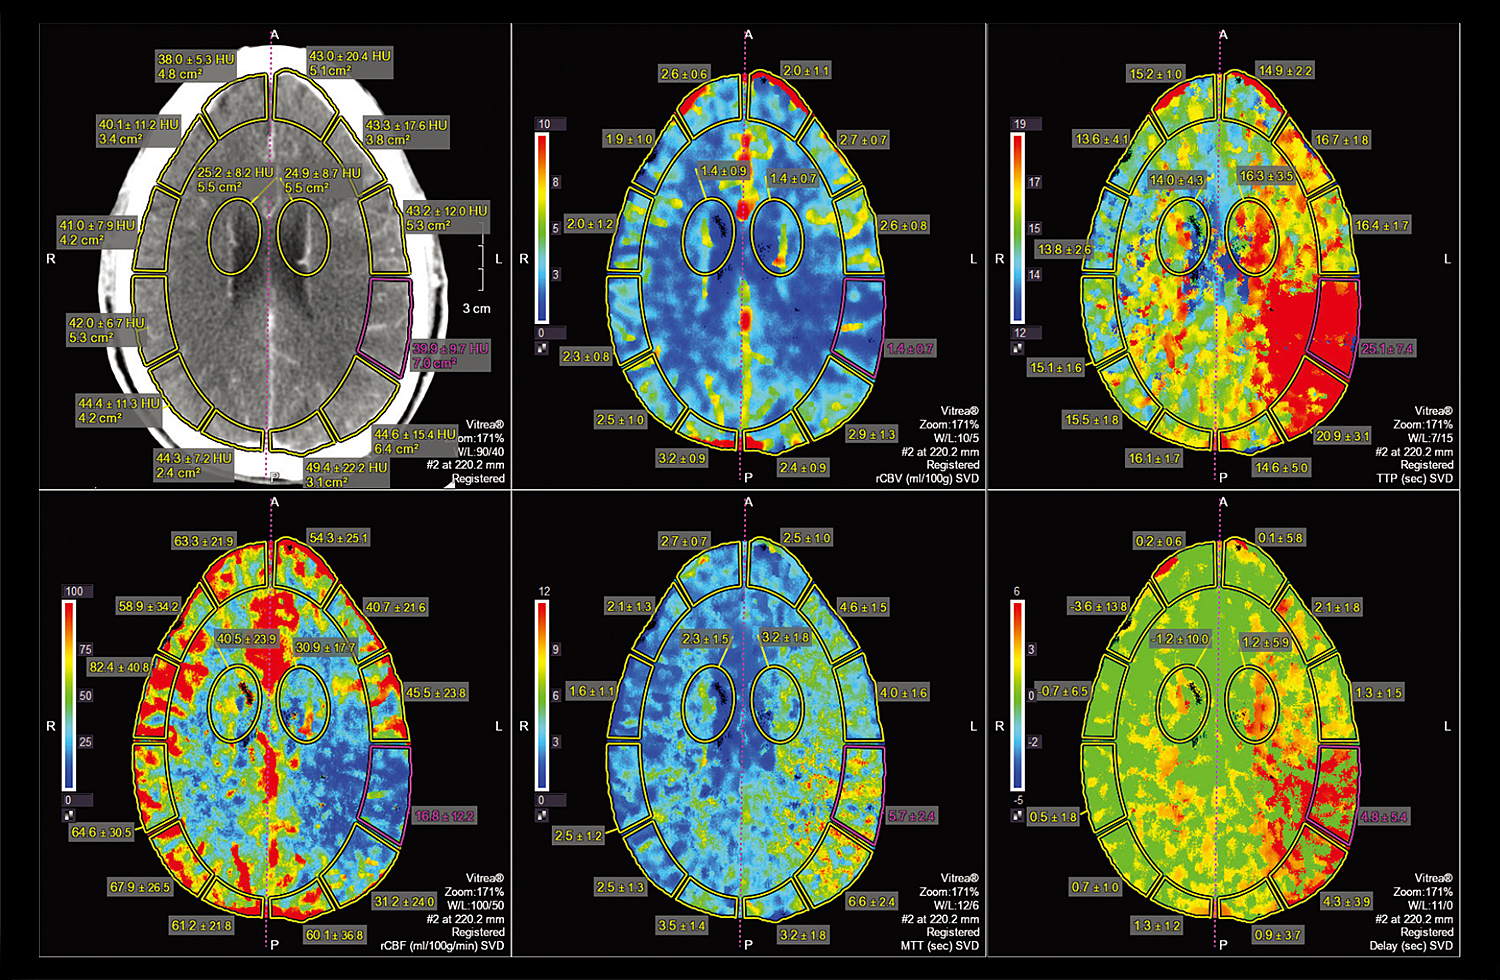
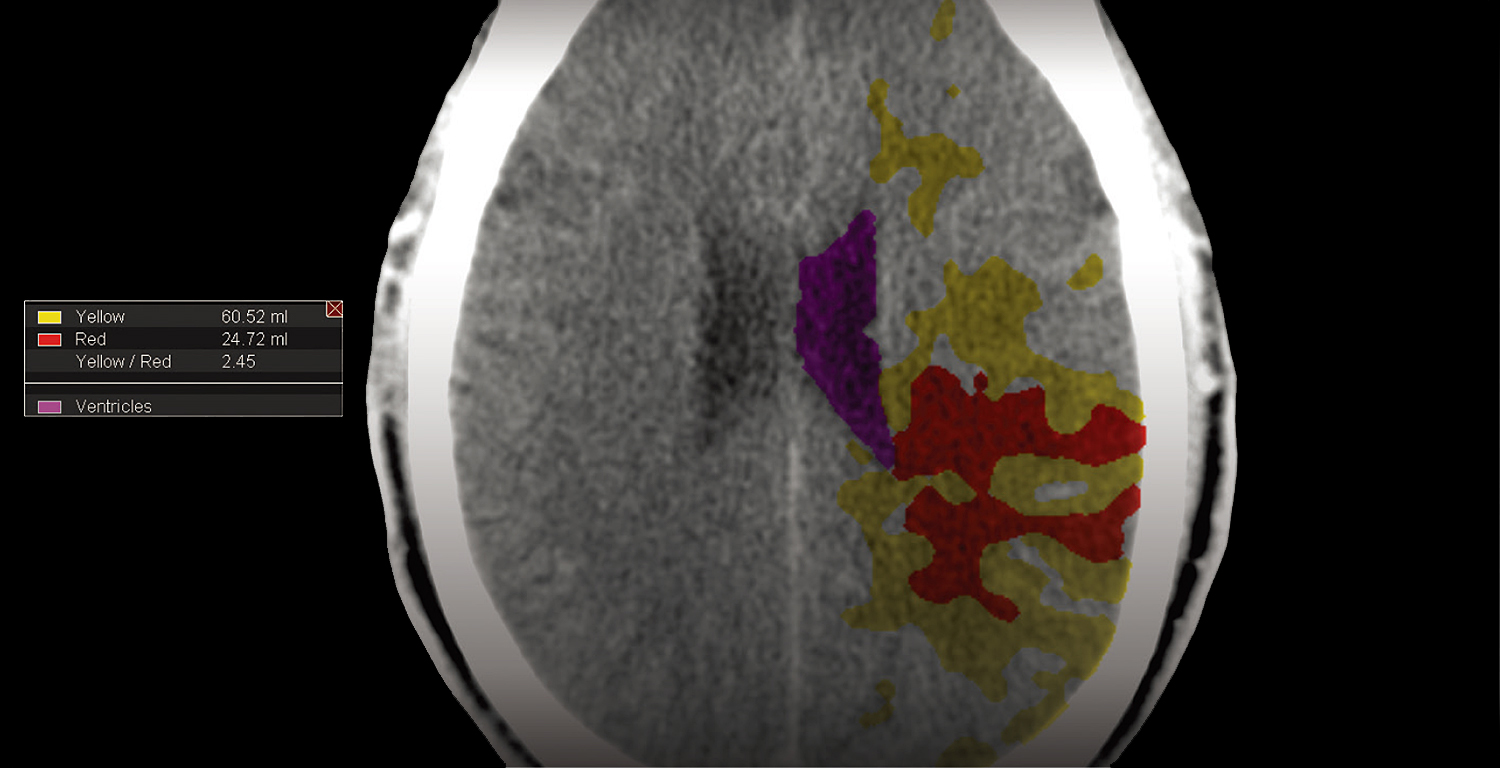
CT Brain Perfusion 2D
CT Brain Perfusion 2D provides visualization of apparent blood flow, blood volume and mean transit time (MTT), which can help physicians determine the presence of acute cerebral infarcts in brain tissue affected in an acute stroke.
Computed Tomography Clinical Applications
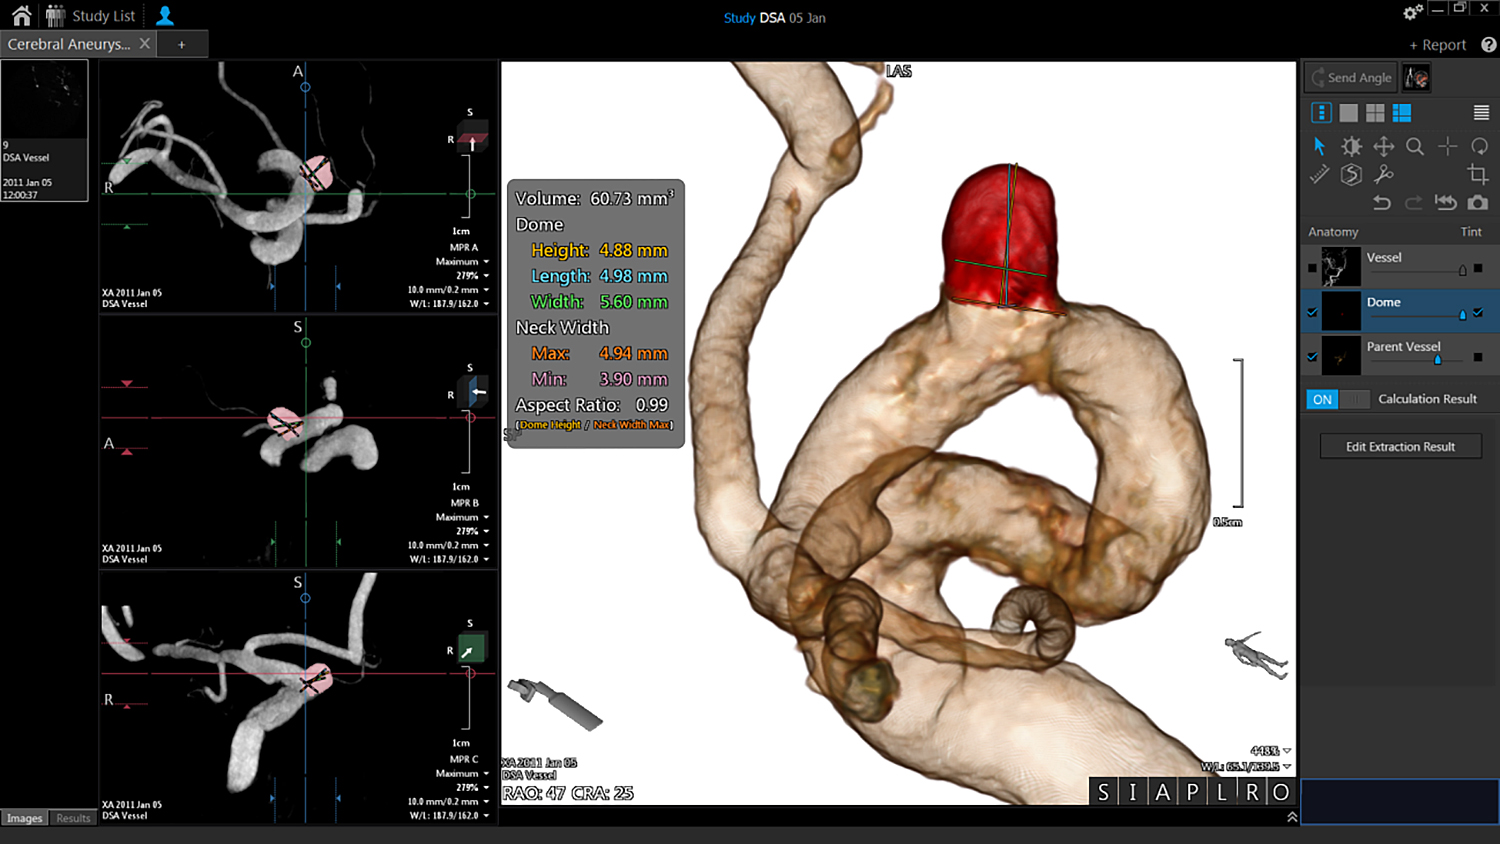
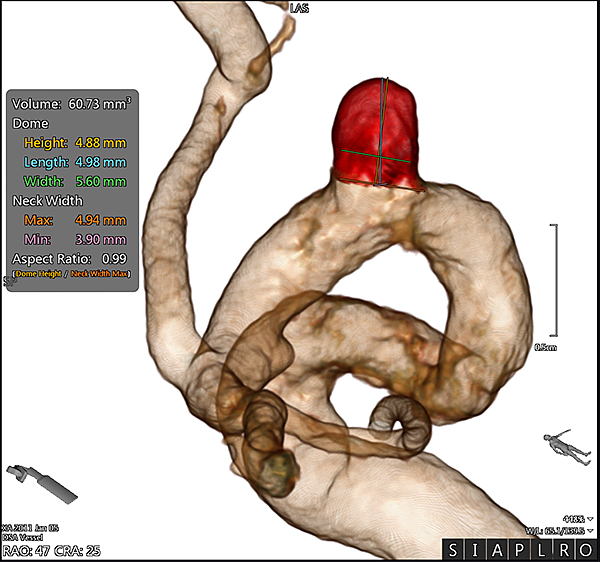
Cerebral Aneurysm Analysis
Cerebral Aneurysm Analysis tool facilitates the extraction and segmentation of a user defined aneurysm in the cerebral arteries.
The software can be used as an adjunct for analyzing the aneurysm dimensions to reduce processing time and increased accuracy.
Computed Tomography Clinical Applications
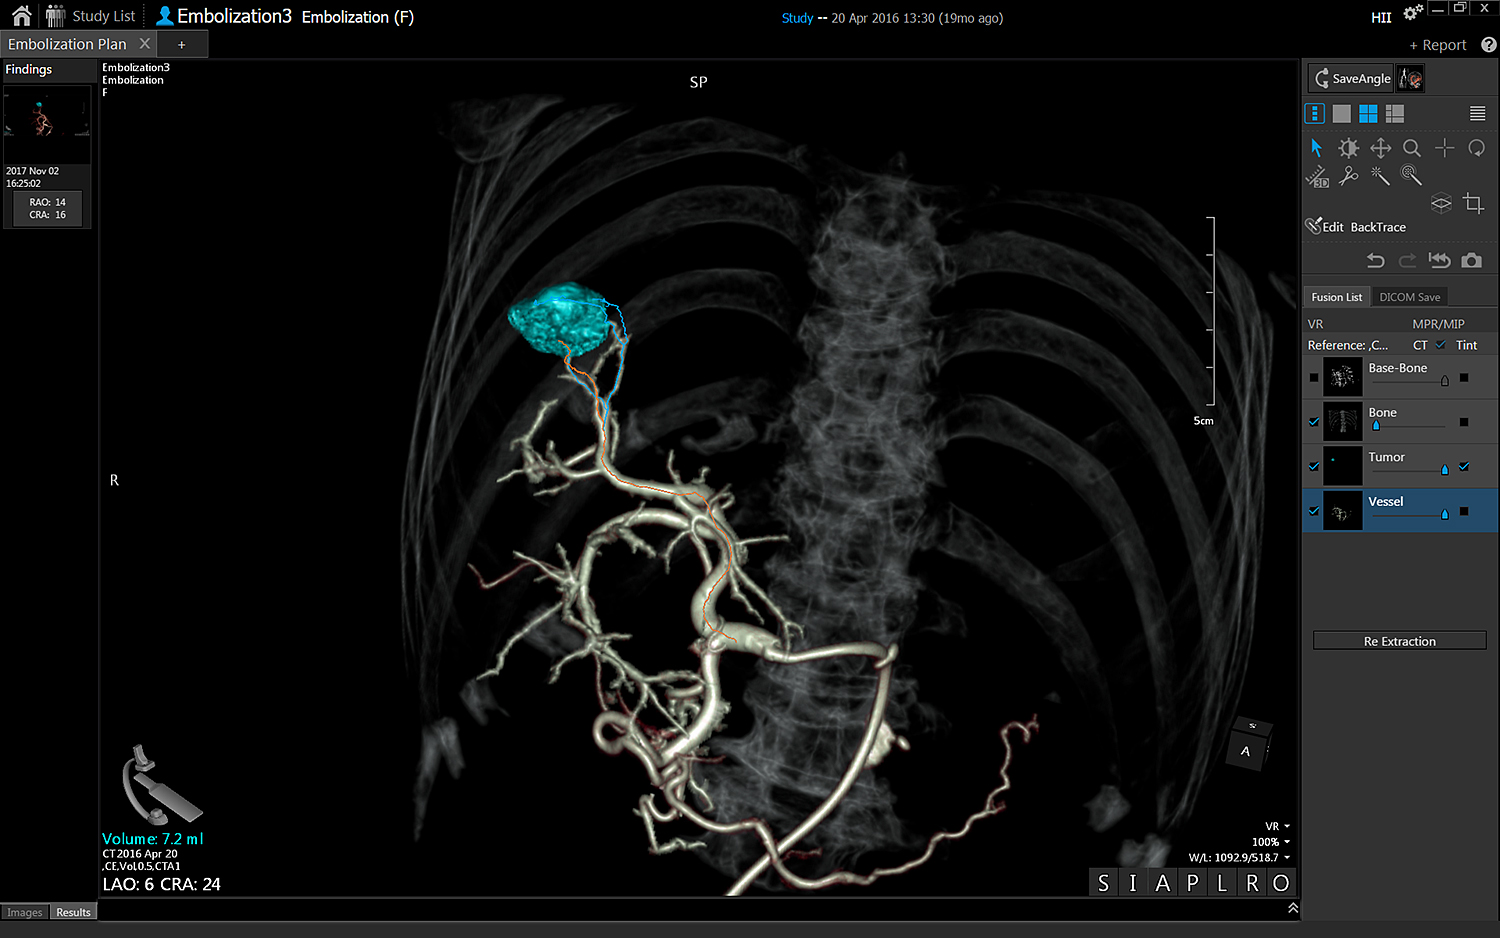
Embolization Plan
Embolization Plan is a dedicated software for advanced embolization. The Software supports an efficient planning for liver tumor treatments. It is applicable to CT volumes of CTHA and /or CTAP acquisitions and XR LCI volumes.